Summary
This post will explain in detail how to form a dashboard with data collected in real time via the linking of Monster agent and ELK stack. It will also demonstrate how, through this, system abnormalities and threats can be both monitored and detected to actively detect security threats.
- The type and content of the events logged by
Monster agent - How to link
Monster agentwith Elastic search, Logstash, Kibana (referred to asELK stackbelow) - How to apply
Logstashfor event filtering, accurate indexing work, and metadata optimization - How to apply
Kibanato form a dashboard
Expectations
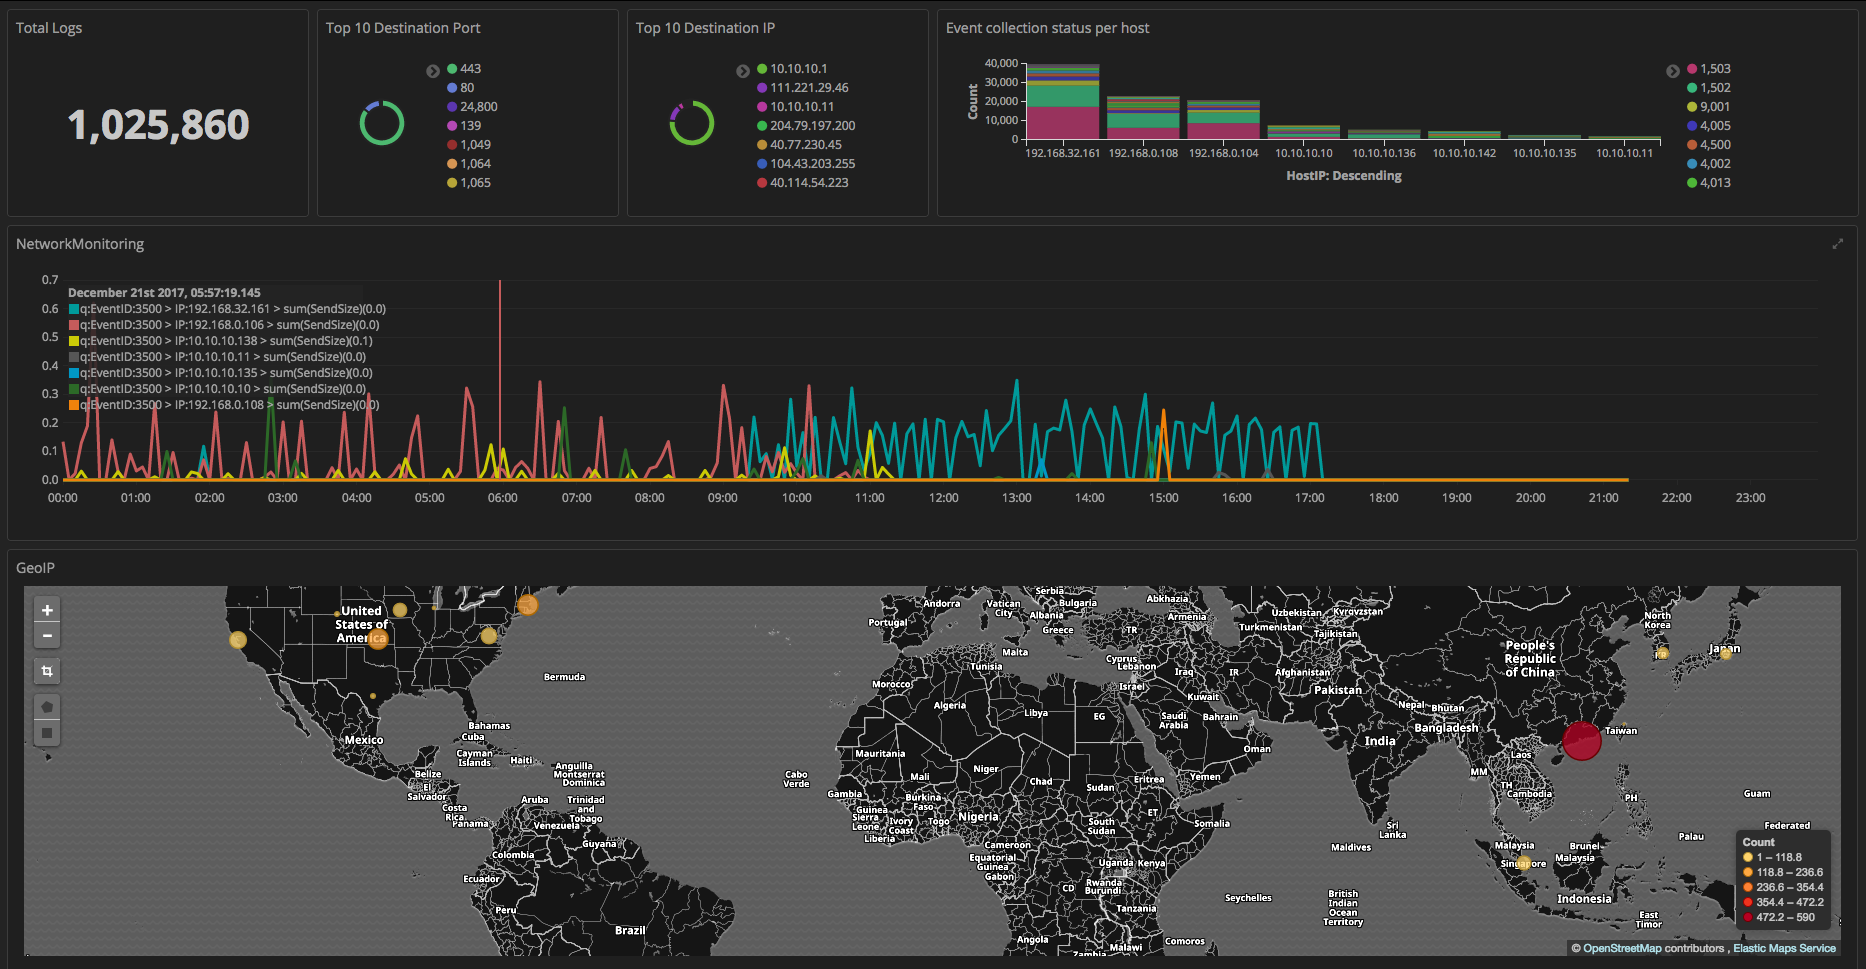
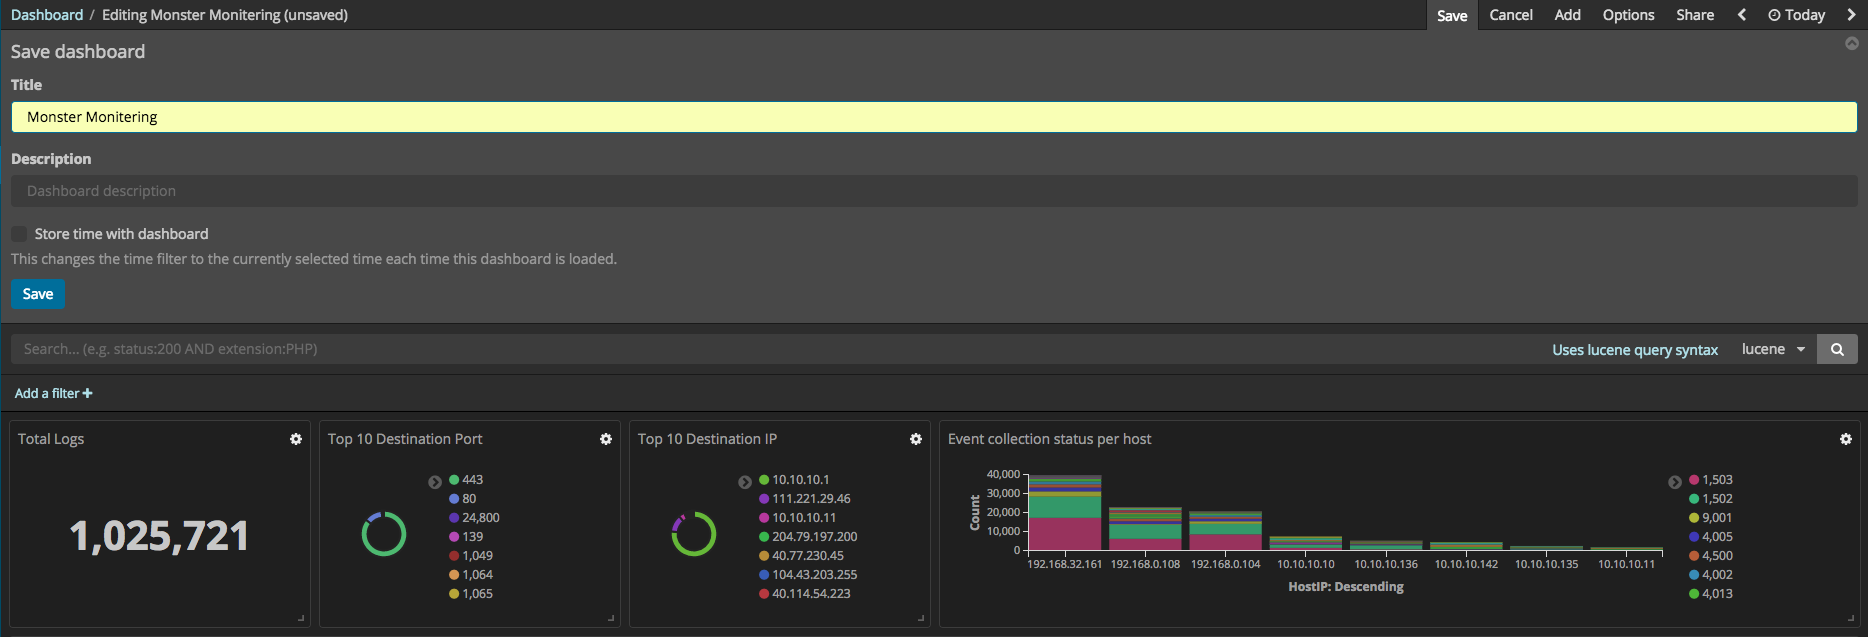
After reading this entire post, you too will be able to create a dashboard screen similar to the image below. If you do not yet have ELK stack, it is recommended that you first install ELK stack. Besides dashboard functionality, Kibana can apply timelion to conduct a diverse time series analysis. timelion is explained indepth in the Elasticsearch official blog here.
Know your Monster Agent Events
Monster agent detects and logs all actions after the execution of a process. Logged events are collected in blocks and are either saved in TSV files or sent to an external system. Event blocks are composed of both summarized and detailed information regarding actions that have occurred. Summarized information collects the file revision number, the file size, and, in the case of a file name change, collects the the file’s new name, along with the aforementioned information.
Statistics of Events
| EventID | Type | Description |
|---|---|---|
| 1500 | statistics | Event logged upon process creation. |
| 1501 | statistics | Event logged upon process termination. |
| 1502 | statistics | Event logged upon image loading from a process. |
| 1503 | statistics | Event logged upon image unloading from a process. |
| 2500 | statistics | Summarized information regarding a process-generated file event. |
| 3500 | statistics | Summarized information regarding a process-generated network event (connect). |
| 3501 | statistics | Summarized information regarding a process-generated network event (accept). |
| 4500 | statistics | Summarized information regarding a process-generated registry. |
Summarized information can first be used to overview the general action flow from the start to the end of a process. Afterwards, detailed information can be helpful in conducting a thorough tracking of actions.
Detailed behavior of the event vs Details of events
| EventID | Type | Description |
|---|---|---|
| 2012 | Detailed information | Event logged when a file event starts. |
| 2014 | Detailed information | Event logged when a file event terminates. |
| 2027 | Detailed information | Event logged when the file name/path is altered. |
| 2030 | Detailed information | Event logged when a new file is created. |
| 4001 | Detailed information | Event logged when a new key value is created in a registry. |
| 4002 | Detailed information | Event logged when an existing key value is opened in a registry. |
| 4003 | Detailed information | Event logged when an existing key value is deleted from a registry. |
| 4005 | Detailed information | Event logged when a new value is created in a registry. |
| 4006 | Detailed information | Event logged when an existing value is removed from a registry. |
| 4013 | Detailed information | Event logged when a registry event terminates. |
Side Note: The format of the Detailed/Summarized information’s data send can be checked here. Using
Kibana, the events mentioned above can be used to create graphs, tables, and circle charts, among other such representations.
ELK Integration
Monster Agent Configuration
Monster agent’s configurations can be changed without additional programs for the purpose of sending event logs. Within the configuration file, kafka or syslog can be chosen to send event logs (the application of Kafka for system linking will be explained in a special post). In this post, logged events will be sent to Logstash using the syslog protocol.
For the best operation of syslog, follow the settings below…
enabled:1server: Logstash serviceIPaddressport:1514(in the case of using a port besides1514, correct the port in both theLogstashandinputfiles)
{
    ...
    "export": {
        ...
        "syslog": {
            "enabled": 1,
            "server": "logstash_ip",
            "port": 1514
        }
    }
}
Side Note: In the case of sending with syslog, there must be a handling capacity of over 2000 messages. To handle over 2000 messages, the kernel parameters must be adjusted. The sysctl command (detailed command:
sudo sysctl -w net.core.rmem_max=2097152) can be used to make adjustments.
Logstash Configuration
Logstash is composed of a pipeline structure of 3 stages, so its detailed contents are the same as the following image. The stages are as follows: data input, generated data filtering, and, finally, the sending (output) of the file/database in a method similar to Elasticsearch.
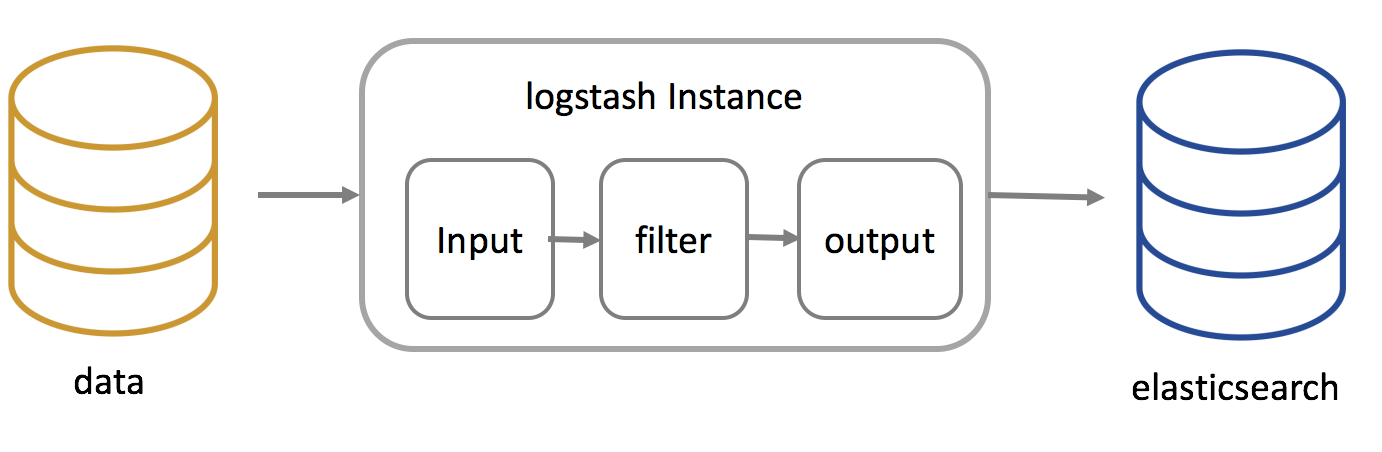
The basic template of the Logstash configuration file is the same as the one below. The file must be constructed in the pipeline order (input->filter->output), so the basic pathway is /etc/logstash/conf.d/*.conf. The name of the configuration file must end in .conf. The configuration file can be simply saved as such a file, so after the creation of the divisions (input, filter, output), the configuration file can be easily made.
input {
    ...
}
filter {
    ...
}
output {
    ...
}
Logstash input
The input plugins that can be used after Logstash installation is the same as below. By referring to the plugin manual, the detailed explanation and settings of each plugin can be found.
> sudo /usr/share/logstash/bin/logstash-plugin list
...
logstash-input-kafka
logstash-input-syslog
logstash-input-tcp
logstash-input-udp
...
In the /etc/lostash/conf.*.conf folder, the 02-input-syslog.conf file will be made along with the following information.
Logstash filter
The filter plugins that can be used after Logstash installation are the same as below. By referring to the plugin manual, the detailed settings for plugins can be found. The filter plugin is a key module of Logstash. After event logging, in the case that you require a constant process, a plugin (e.g. csv, json, mutate, ruby) can be used to do so. For instance, if you want to extract IPs after you log the access.log of a web server, you can use the drop plugin and, in the case that there are 200 reply codes in the log information, you can choose not to log. In addition, the ruby plugin can be used in filtering input data. Among the logged events, the data in the TIMESTAMP field can be changed into string type using the ruby plugin.
> sudo /usr/share/logstash/bin/logstash-plugin list
...
logstash-filter-csv
logstash-filter-elasticsearch
logstash-filter-jdbc_streaming
...
The data logged via the Monster agentis in TSV format, so the basic example of filtering using the CSV plugin is the same as below. In the case that you do not configure the column names, they are set as Column1, Column2, Column3, Column4, Column5. After setting the columns to names that agree with the data format in use, it is best to change the autogenerate_column_names(default:true) value to false before use. As the basic value of separator is ,, you must change it to "" in the case of a TSV format.
filter {
    csv {
            columns => ["EventID"]
            separator => "	"
            autogenerate_column_names => false
    }
}
EventAPI can be used to read and process logged data to create a new field. A detailed explanation can be found in the EventAPI Manual. Specifically, event.get('field_name') and event.set('field_name') can be used, respectively, to read data and set field values to the fitting processed data. Below is ruby code that changes the format of the Windows FILETIME to string type. Elastictouch only supports until millisecond, so the character string format must be made as '%Y-%m-%d %H:%M:%S.%3L'.
ruby {
    code => "
            puts rubyTime = Time.at(((event.get('CollectTimestamp(UTC)').to_i)/10000000) - 11644473600)
            event.set('ImageCreateTime(KST)', rubyTime.strftime('%Y-%m-%d %H:%M:%S.%3L'))
            "
    }
The geoip plugin can be used with the Maxmind GeoLite2 database as the foundation to get the address and information of an IP address. The settings can mirror the following code. Detailed settings can be found on the geoip plugin manual.
geoip {
        source => "[DestinationIp]"
        target => "[DestinationGeoip]"
    }
Using the aforementioned plugins, the finally created configuration file information can be downloaded, copied to the /etc/lostash/conf.d folder, and then used. In the code below, if/else if/else is used to process each event by ID. The configurations are set to change the time values to string type.
Logstash output
The filter plugin that can be used after Logstash installation is the same as the following. By referring to the plug-in manual, the detaild settings for plugins can be found. Events for which processing has been finished can be linked with a variety of systems using plugins (e.g. elasticsearch, csv, s3, pipe).
...
logstash-output-csv
logstash-output-elasticsearch
...
The settings for sending data via Elasticsearch are the same as below, so the 90-output-elasticsearch.conf file can be created in /etc/logstash/conf.d with said settings. In the case that the system does not have Elasticsearch downloaded, localhost must be replaced with ip, such that the Elasticsearch index generated is classified by date. Beyond that, explanation of detailed settings can be found by referring to the plugin manual.
Elasticsearch Configuration
After logging an event, in the case that analysis is conducted without detailed mapping information, the data is automatically seen as string type, so many features, including checking the network’s total reception and the IP address location information, cannot be used. Therefore, after logging an event, you should only begin analysis with Kibana after setting up for the data type to match the columns. Moreover, it is better if, instead of re-mapping eveytime an index is created, a template is created whereby everytime a new index is created, the mapping settings are automatically done.
| Relational Database | Elasticsearch |
|---|---|
| Database | Index |
| Table | Type |
| Row | Document |
| Column | Field |
| Schema | Mapping |
| Index | Everything is indexed |
| SQL | Query DSL |
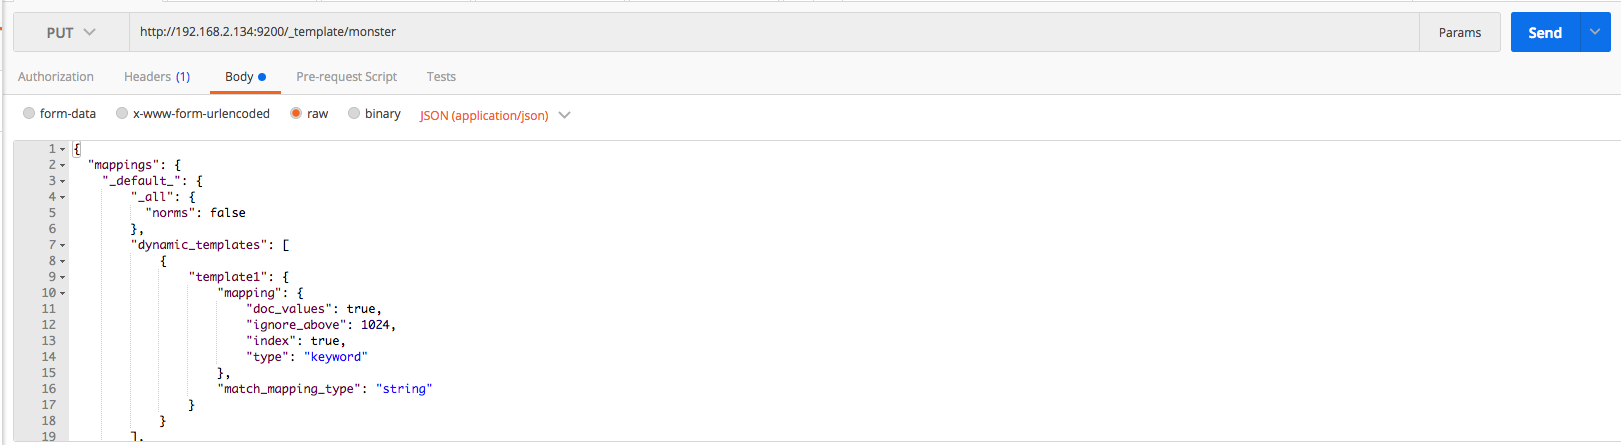
The Elasticsearch mapping template for Monster Agent is the same as that below. Detailed information on settings can be found on the official website.
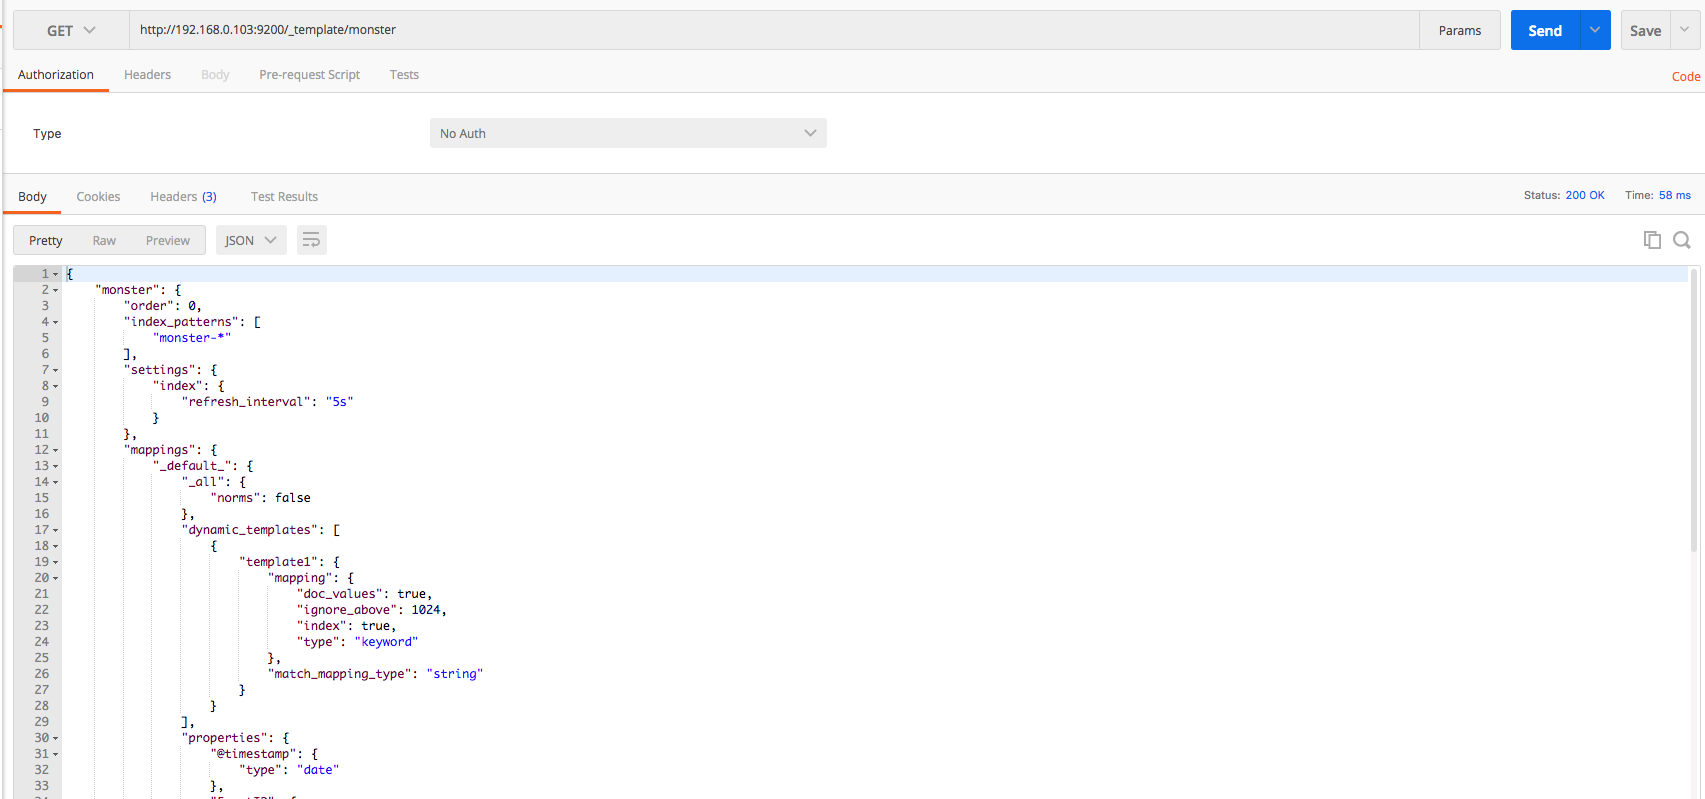
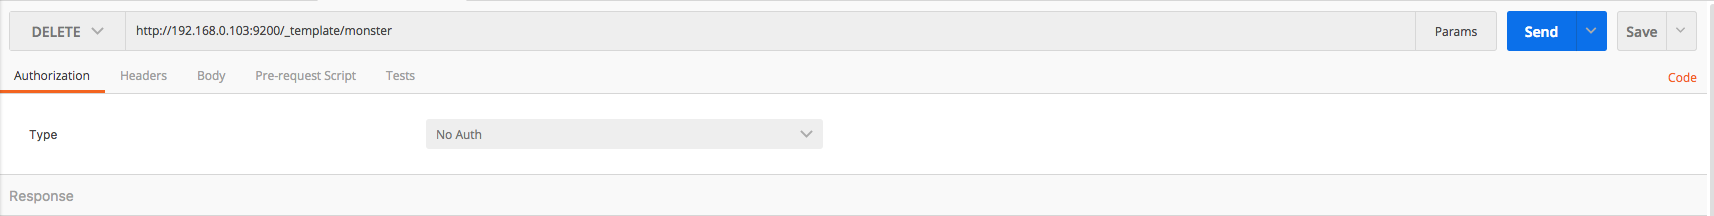
When creating/deleting/checking the mapping template, use postman or kibana. Use the put, get, and delete methods, respectively, for creating, checking, and deleting a template. The mapping template can be downloaded here. The overall process can be executed by referring to the following images.
Kibana Configuration
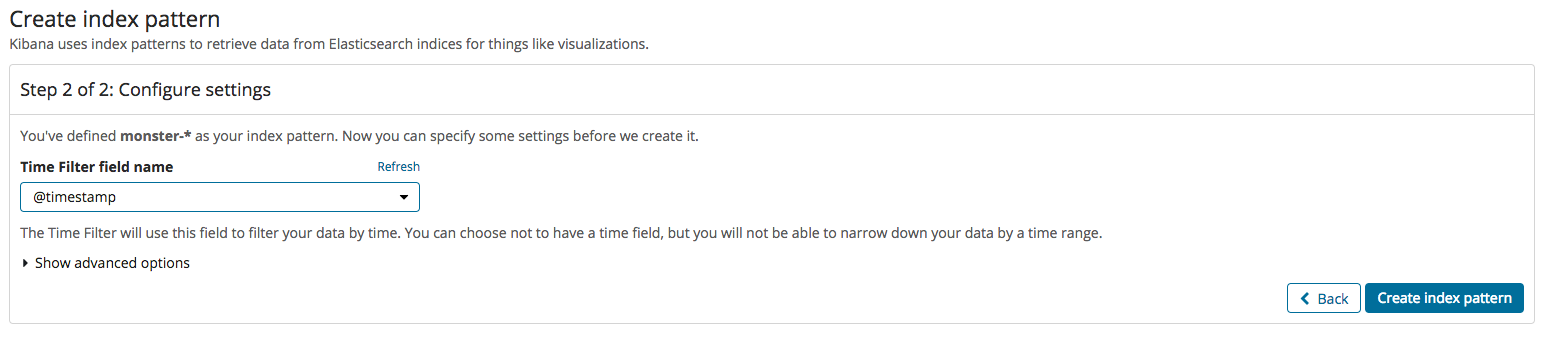
If everything has worked normally, namely that indexing worked normally after the events processed in Logstash were inputted into Elasticsearch, a new index must be made in Kibana. That process is the same as the two images below. Index creation is divided into two steps: firstly, enter the index name, and, secondly, set the time field value.

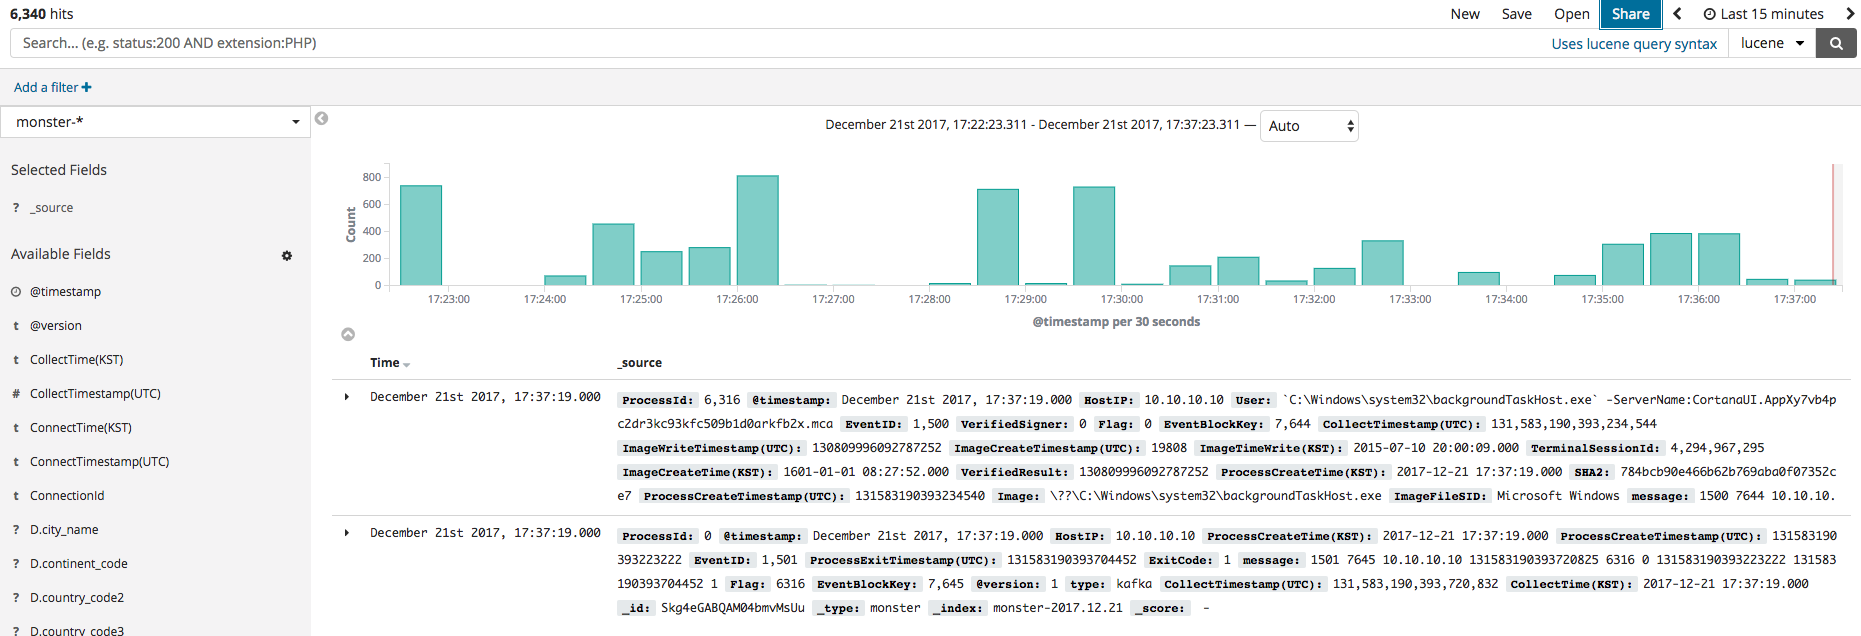
If the index was created, the Discover menu can be clicked to identify, as shown below, the events currently logged. Before using the dashboard employing Kibana, the menu will first be briefly explained. The primary features of Kibana are Dashboard, Discover, Visualize, and Timelion. The data visualizations and elements produced in Visualize can be shown in Dashboard. Discover allows the filtering and searching of needed data among the event logs. Timelion is useful in time series analysis.
Dashboard
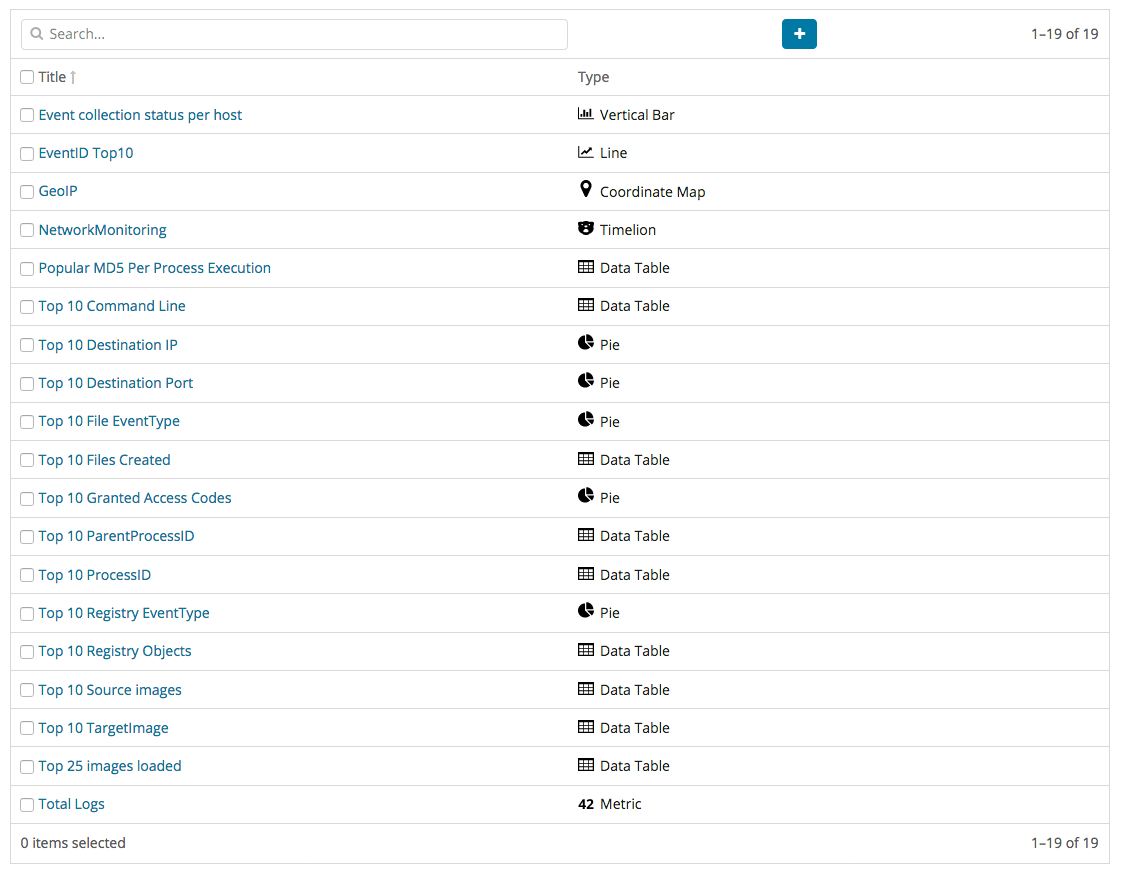
To create the dashboard, the individual visualizations and elements must first be created. Currently, Kibana has for analytical representations bar charts, data tables, charts, time series analysis, and more. After creating the individual visualizations and elements, as shown in the image below, the dashboard can be made into the design that you desire. To create the visualizations and elements, however, a knowledge of Aggregation, Bucket, and Metric is required. Aggregation analyzes and summarizes from the total data set. Bucket refers to a set of documents, each of which focus on a specific set of criteria. Metric is statistical data of the documents contained within Bucket. Therefore, all Aggregations are grouped together with more than one Bucket and more than one Metric.
Data Table
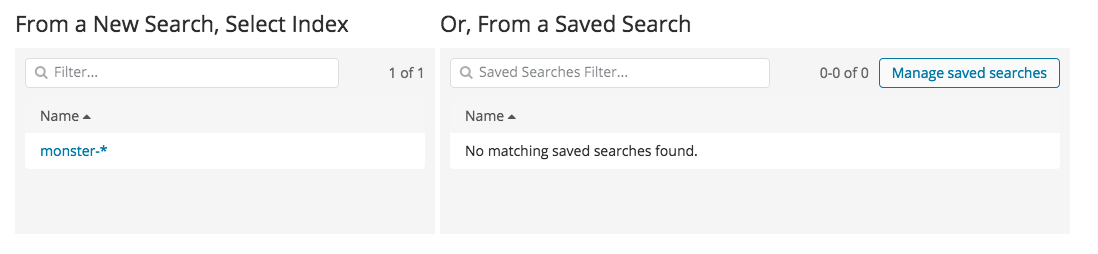
Following details how to create the data table, the basic element of the dashboard. Select the Visualize menu, then select Data Table, and you should see a screen similar to that shown in the image below. In all Visualize steps, the index must first be selected. In the case of the screen below, monster-* should be selected.
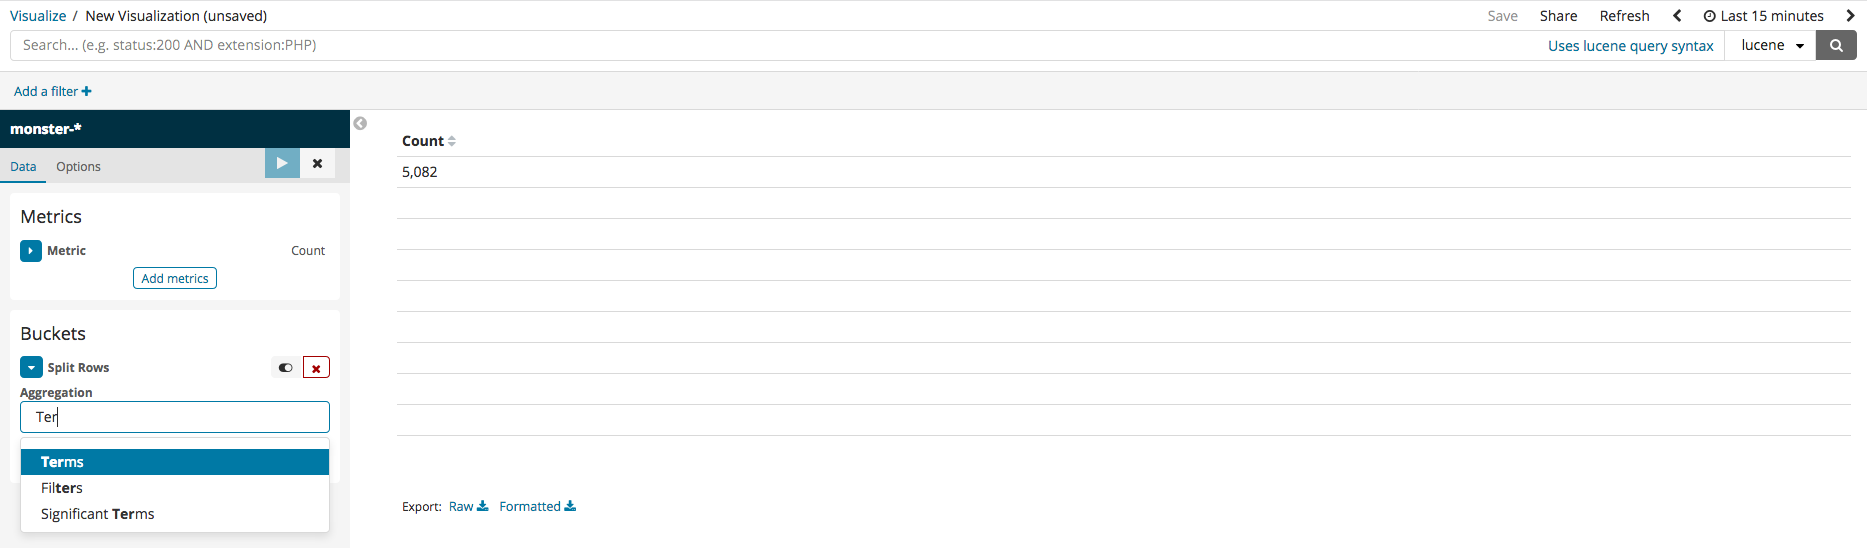
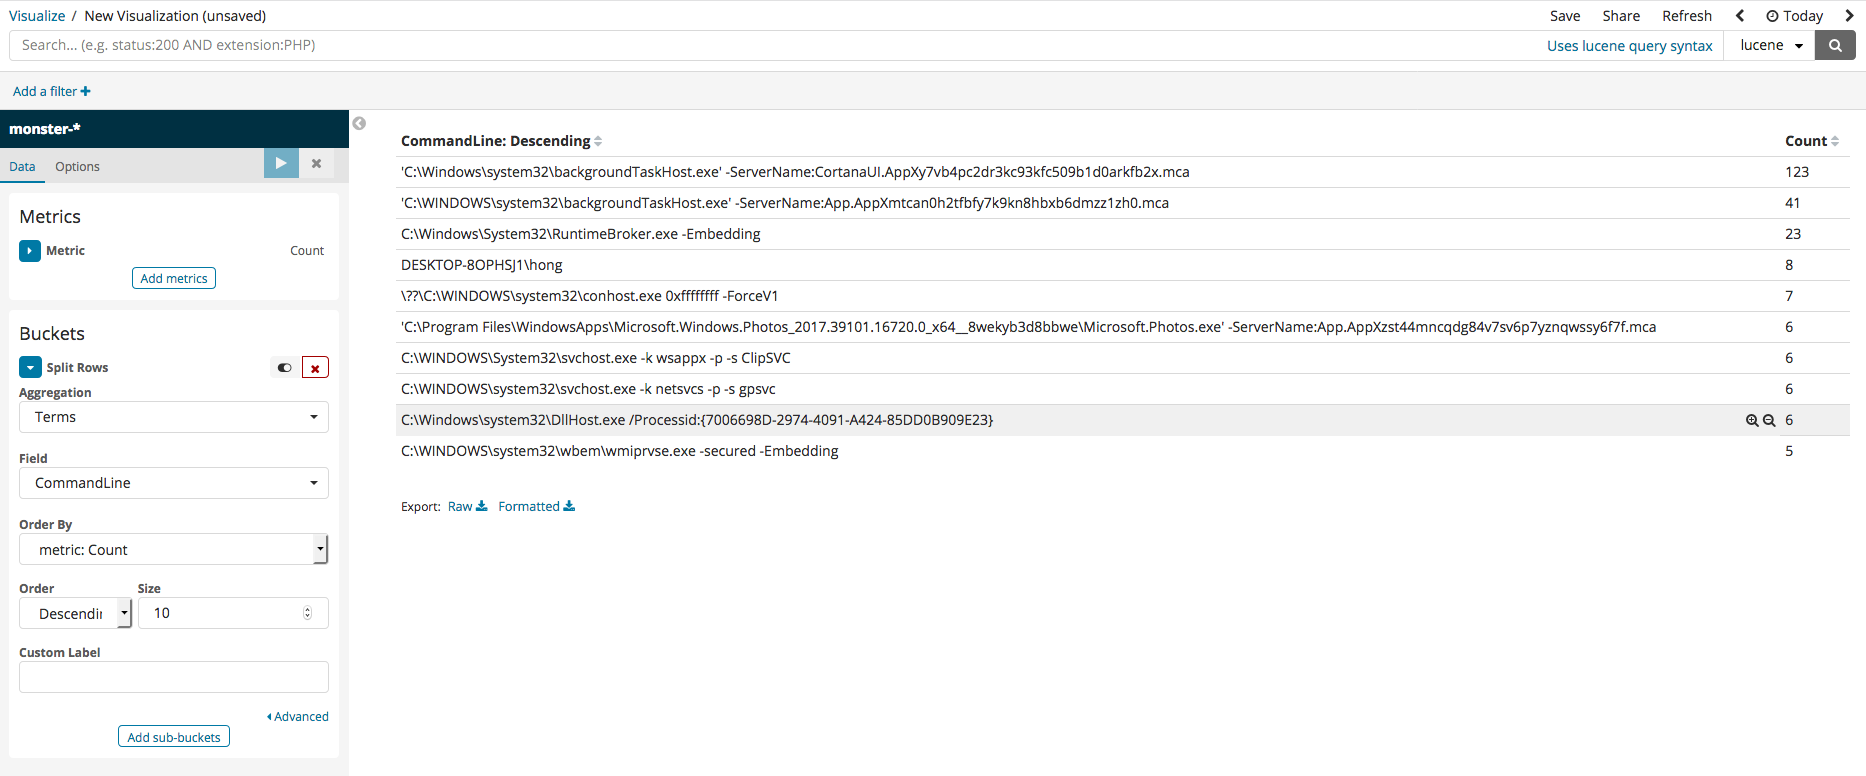
Metric aggregation refers to the statistics calculated in the bucket document. The types of buckets include Terms, IPv4 Range, and GeoHash. The terms bucket is to be used, so the metric is Count. It should be additionally noted that the example data table made here will be collating the most frequently used process names and command lines. To do this, firstly select split rows, then select Terms, and all the columns within the current index should be visible. Among those, select Commandline, run, and the data of the command lines, ranked by their number in descending order, can be seen.
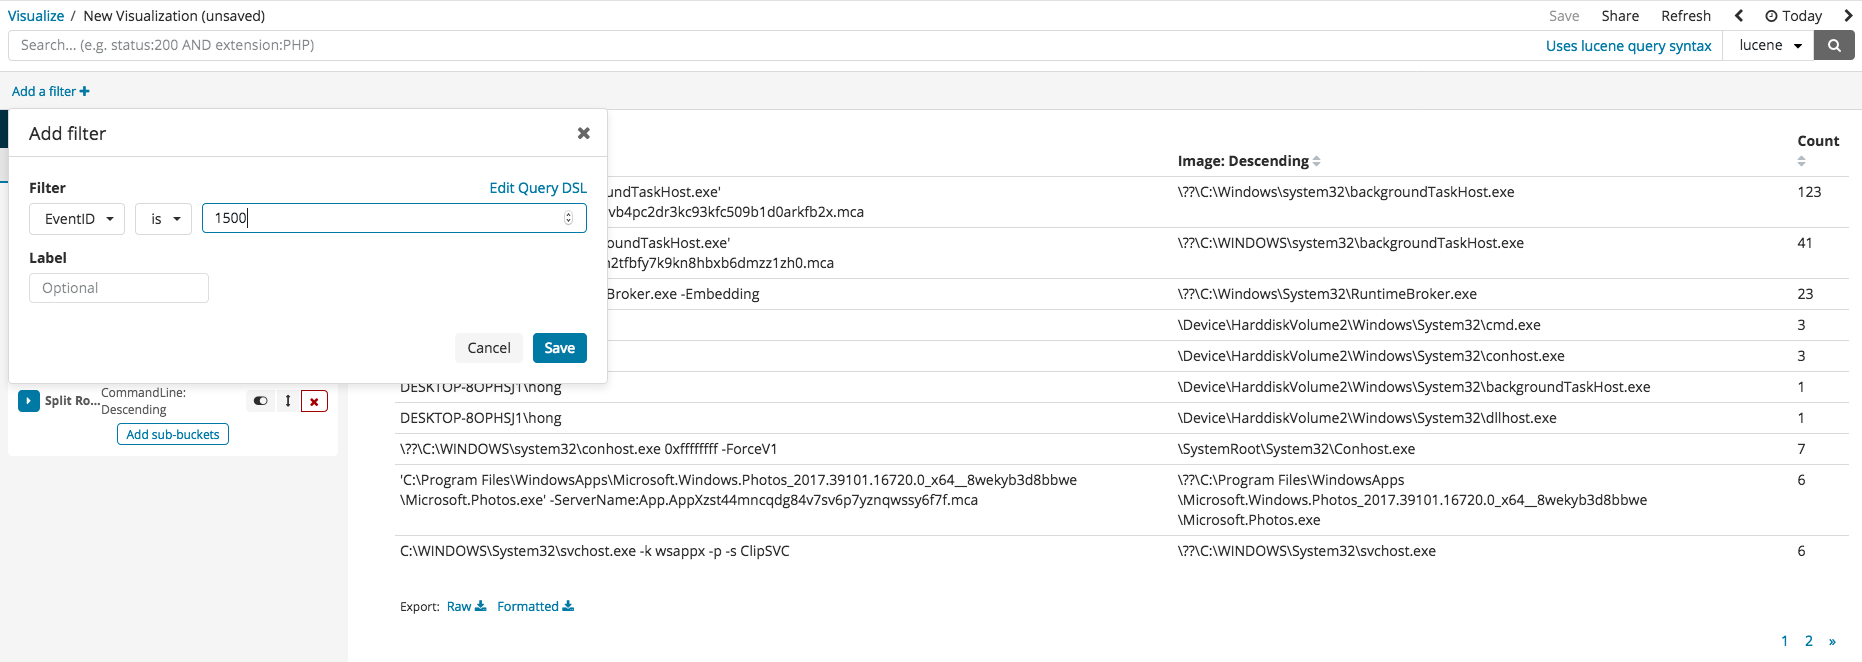
Split Rows can be clicked again to add an extra column. CommandLine can be used in a similar way to add an extra field. For the the column name, Image will be selected. Once all the settings are finished, the result upon running should be similar to the following image.
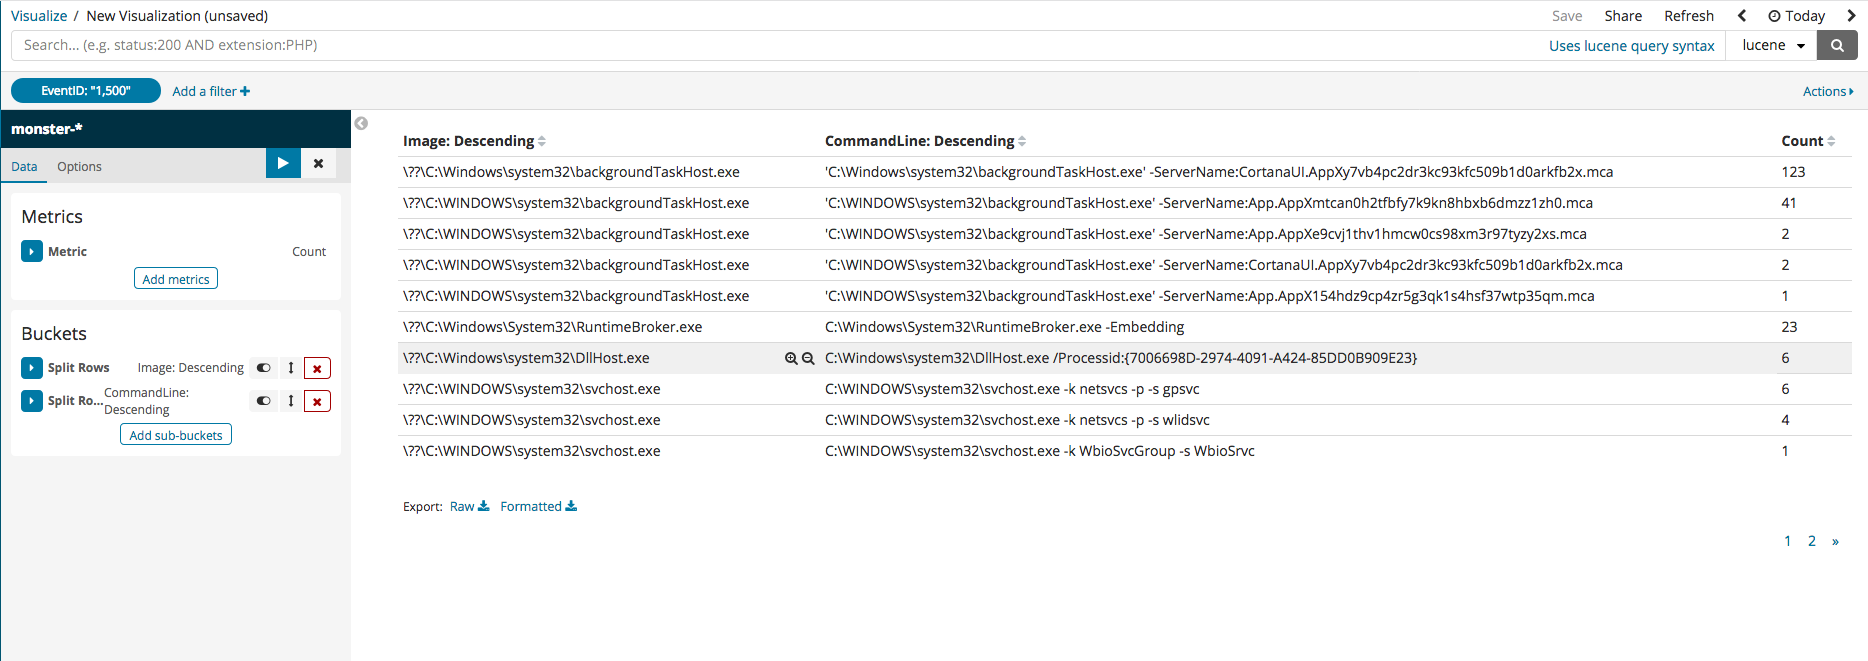
After pressing index, filtering can begin with the current values available in the index columns. The following image gives an example of filtering only the EvenID with 1500. Filter settings for digital signatures can be selected to view those which cannot be trusted or those with abnormal states.
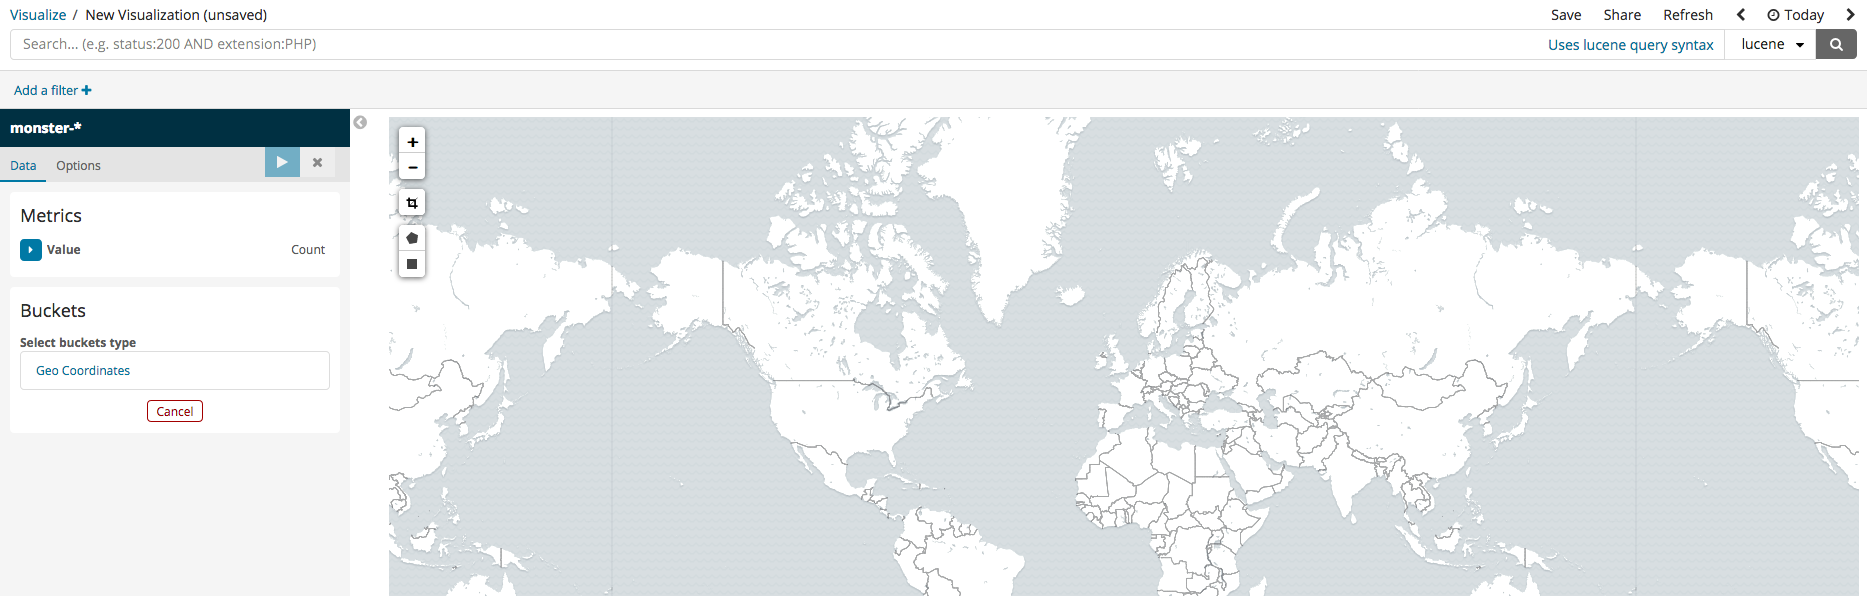
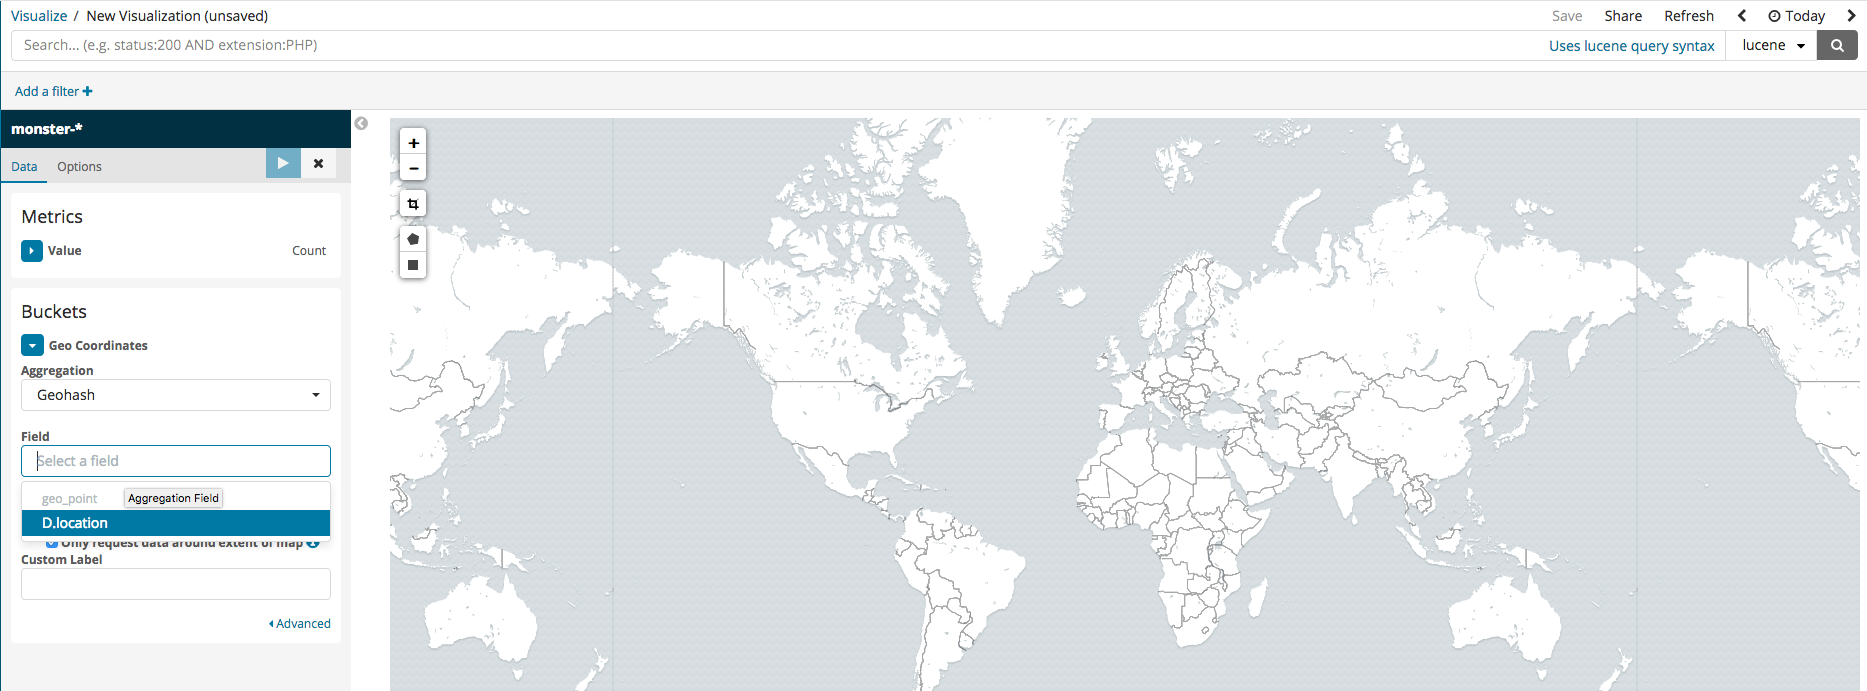
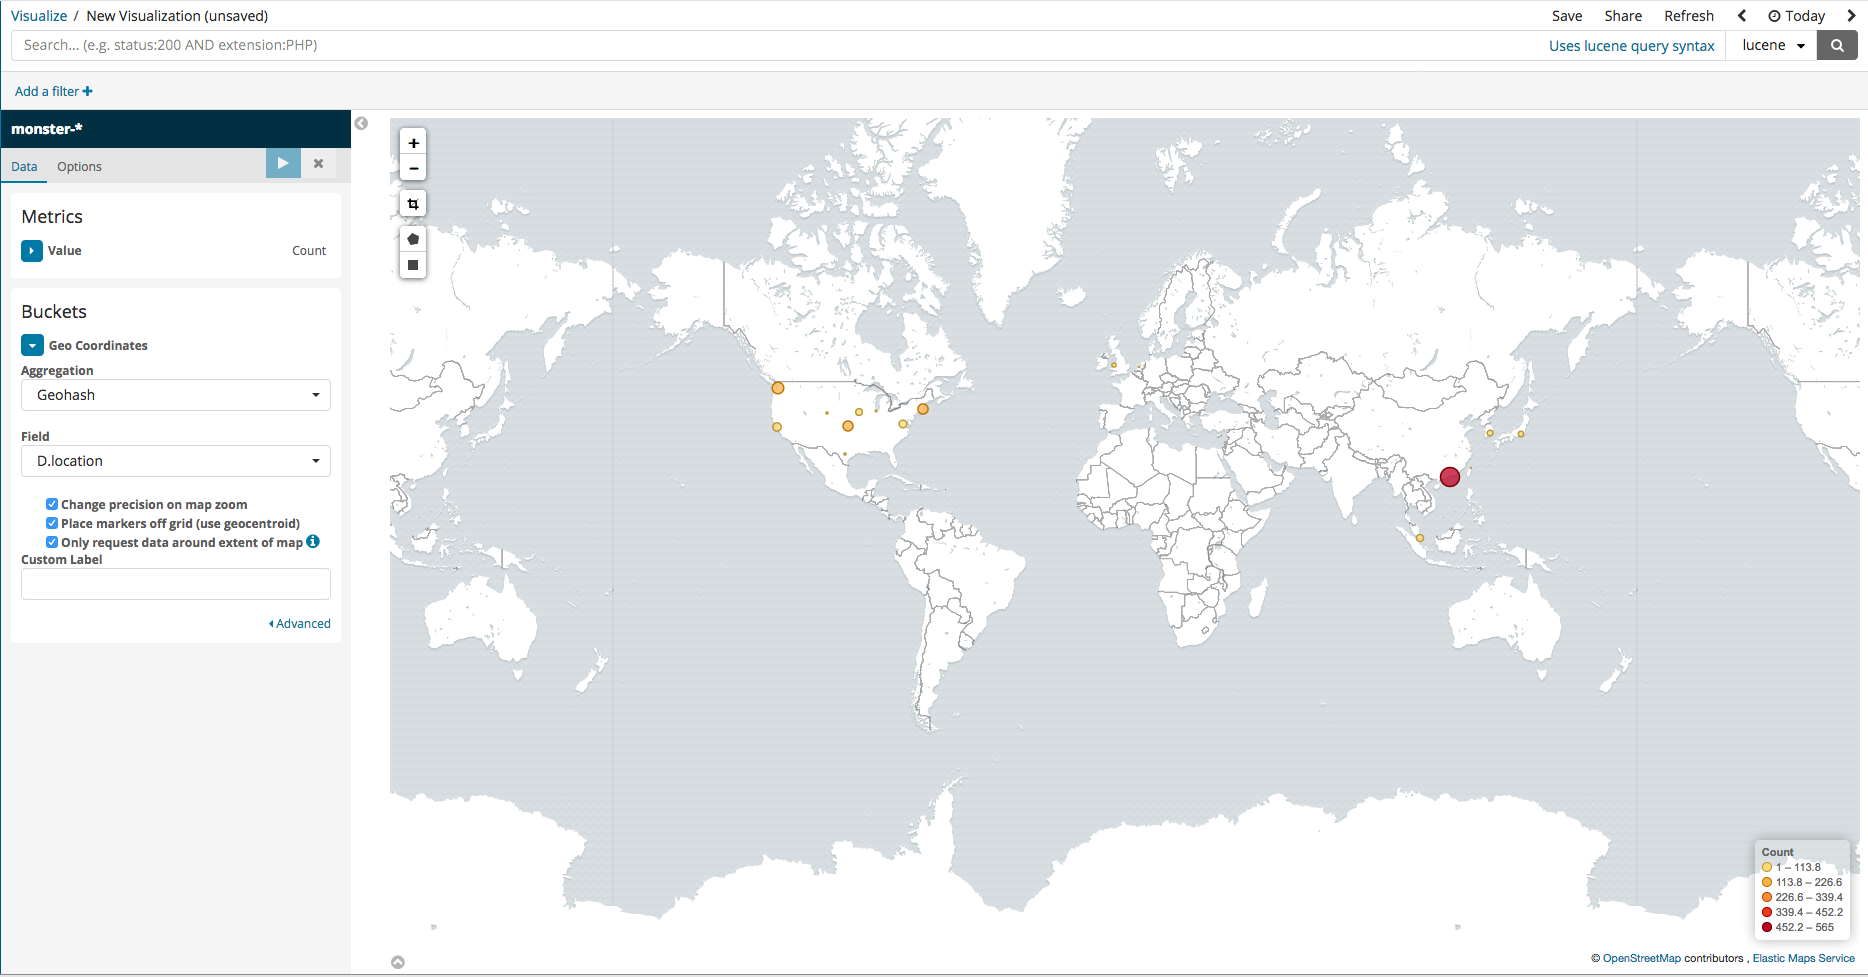
Coordinate Map
In the case that the logged events include DestinationIP, GPS information can be analyzed and inputted into Elasticsearch together. Among the various Kibana features, there are ways to visually pinpoint the location on a map. To set this up, simply follow the steps in the images below.
Pie
Using a circle graph (or pie chart), lots of information can be visualized, including file even type, registry event type, destination IP, and destination PORT. After pressing Split Slices, select the terms to agree with the data table, and, in the image below, the top 10 counts of DestinationIP can be see in descending order.


Vertical Bar
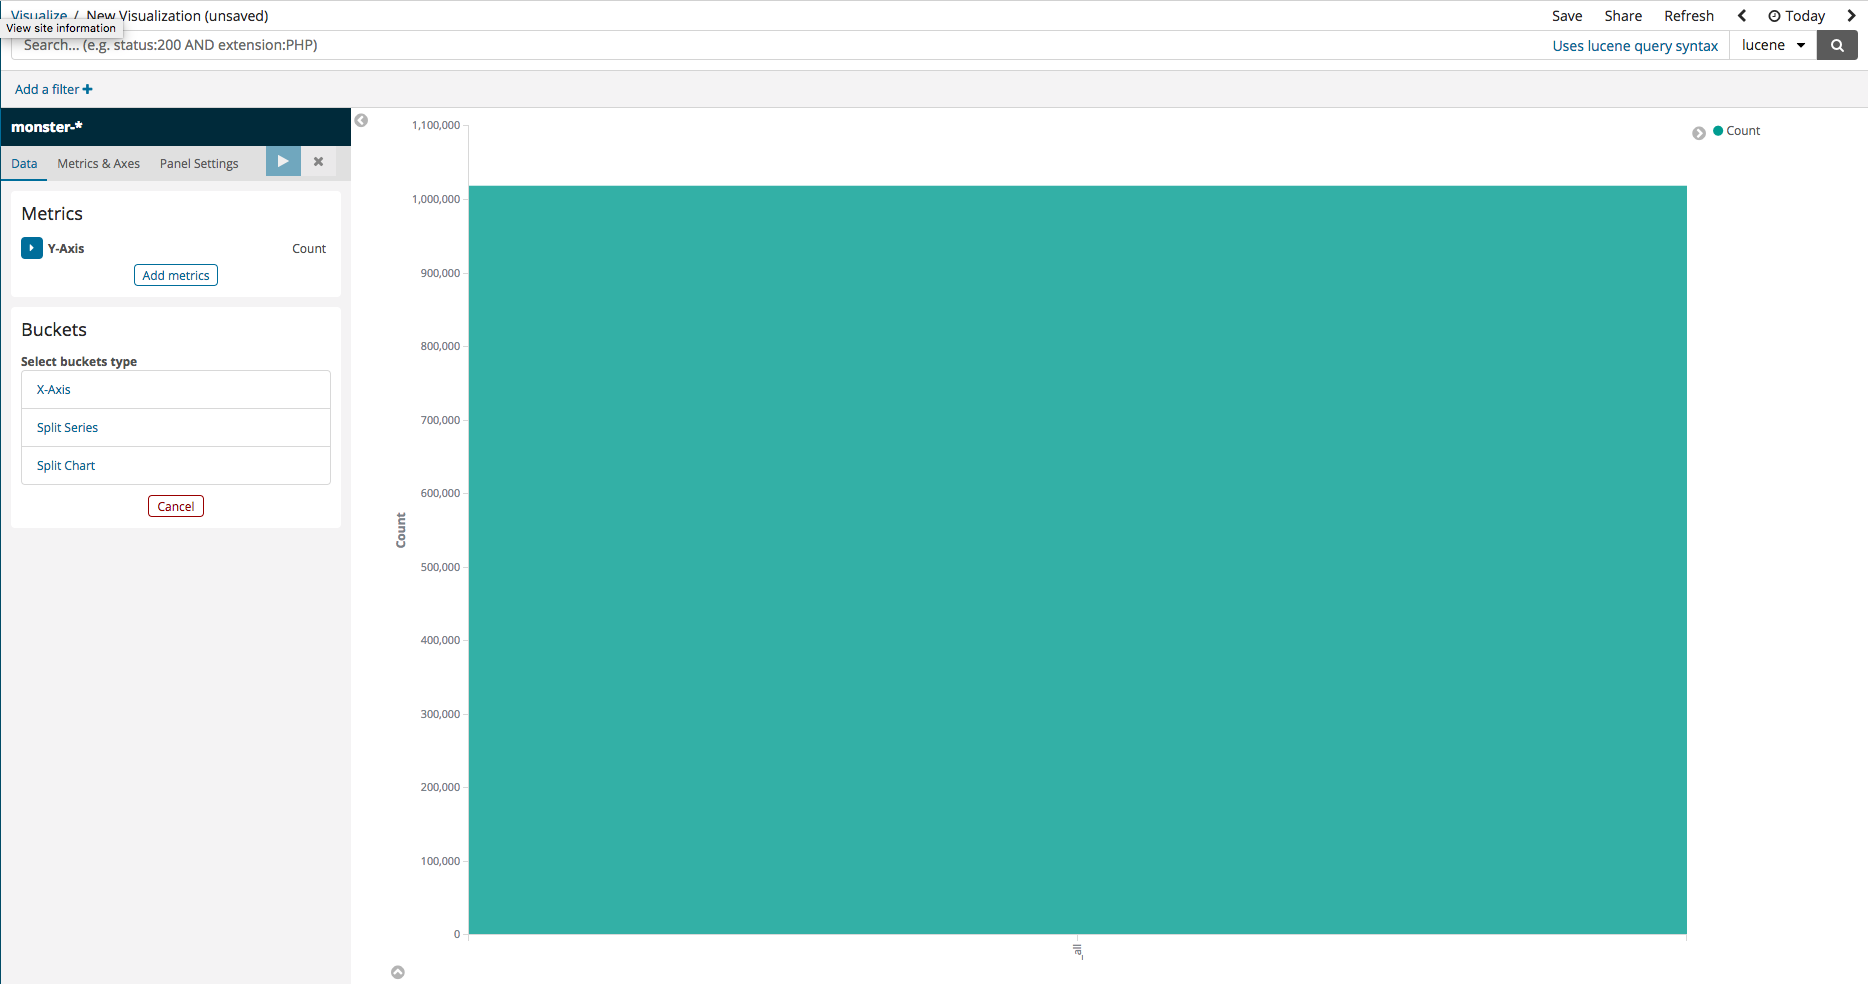
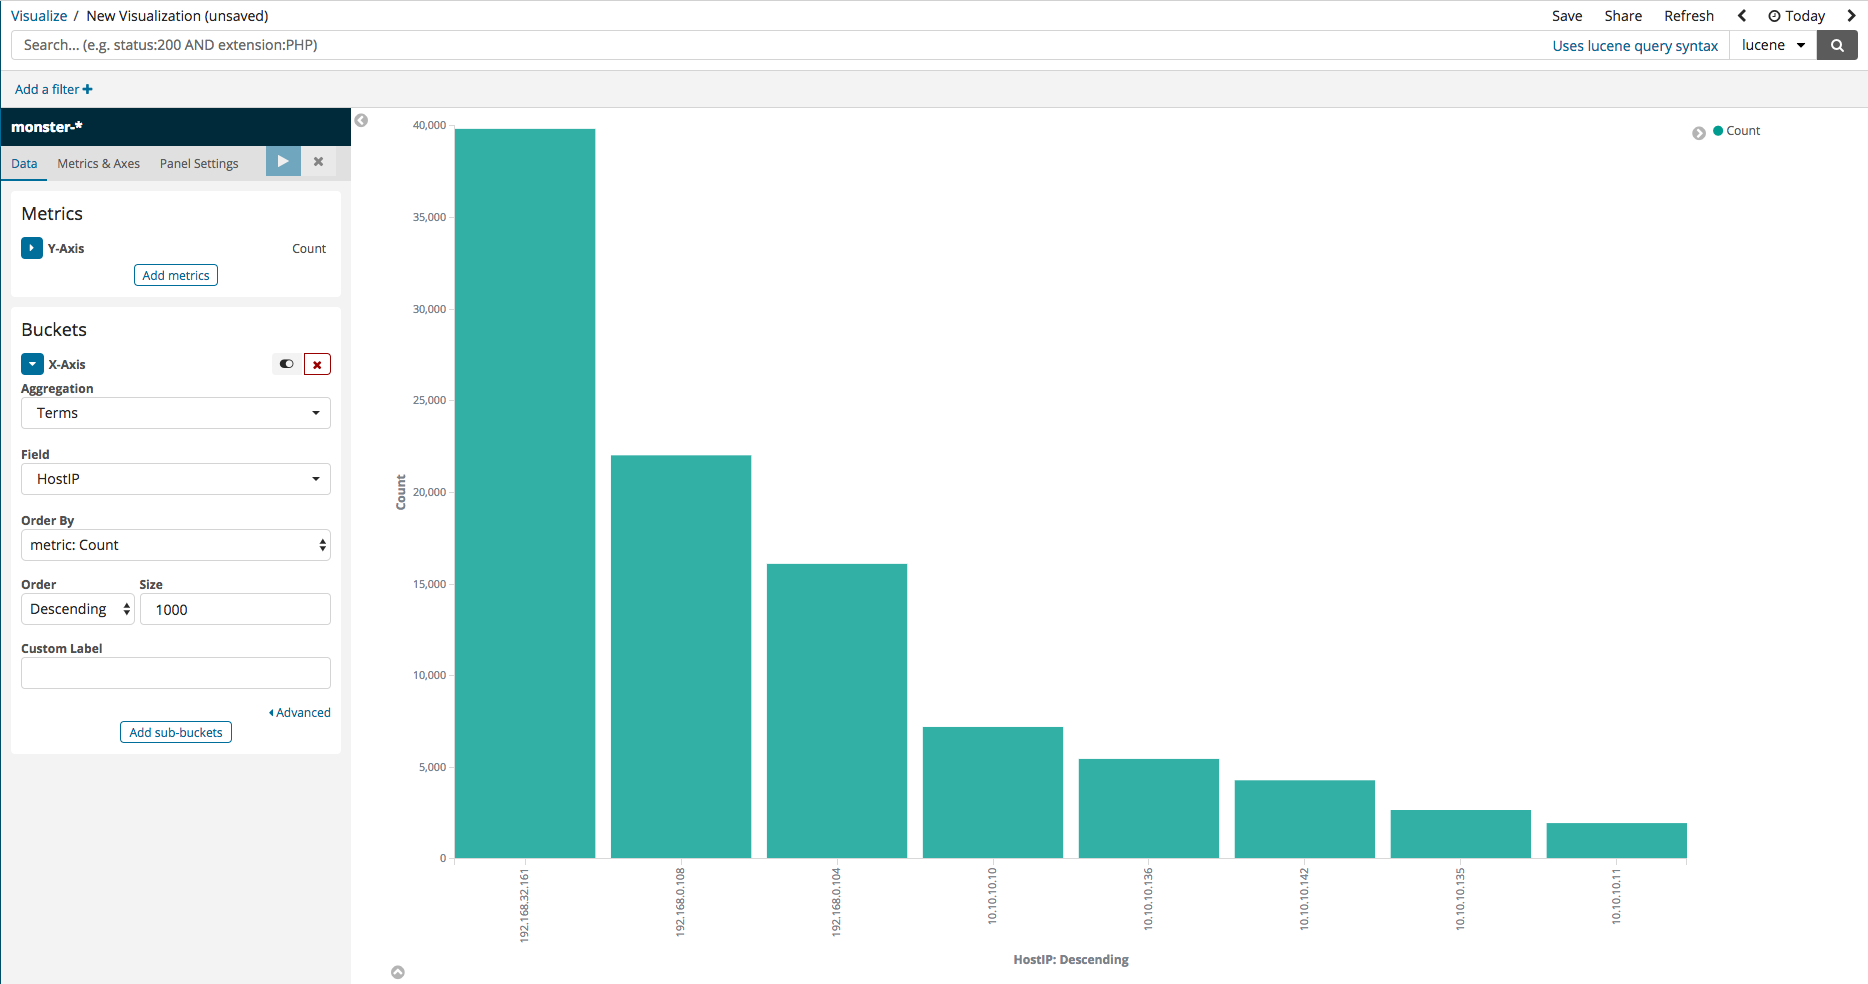
Here, an example is shown where a visualization can be created to view the number of events logged per host in the case that Monster Agent is installed in a variety of sources. Select Vertical Bar from the Visualize menu, then, upon seeing a screen similar to that in the first image below, select X-axis. Running after set-up should display the second image below, where the logged events are divided according to their ID.
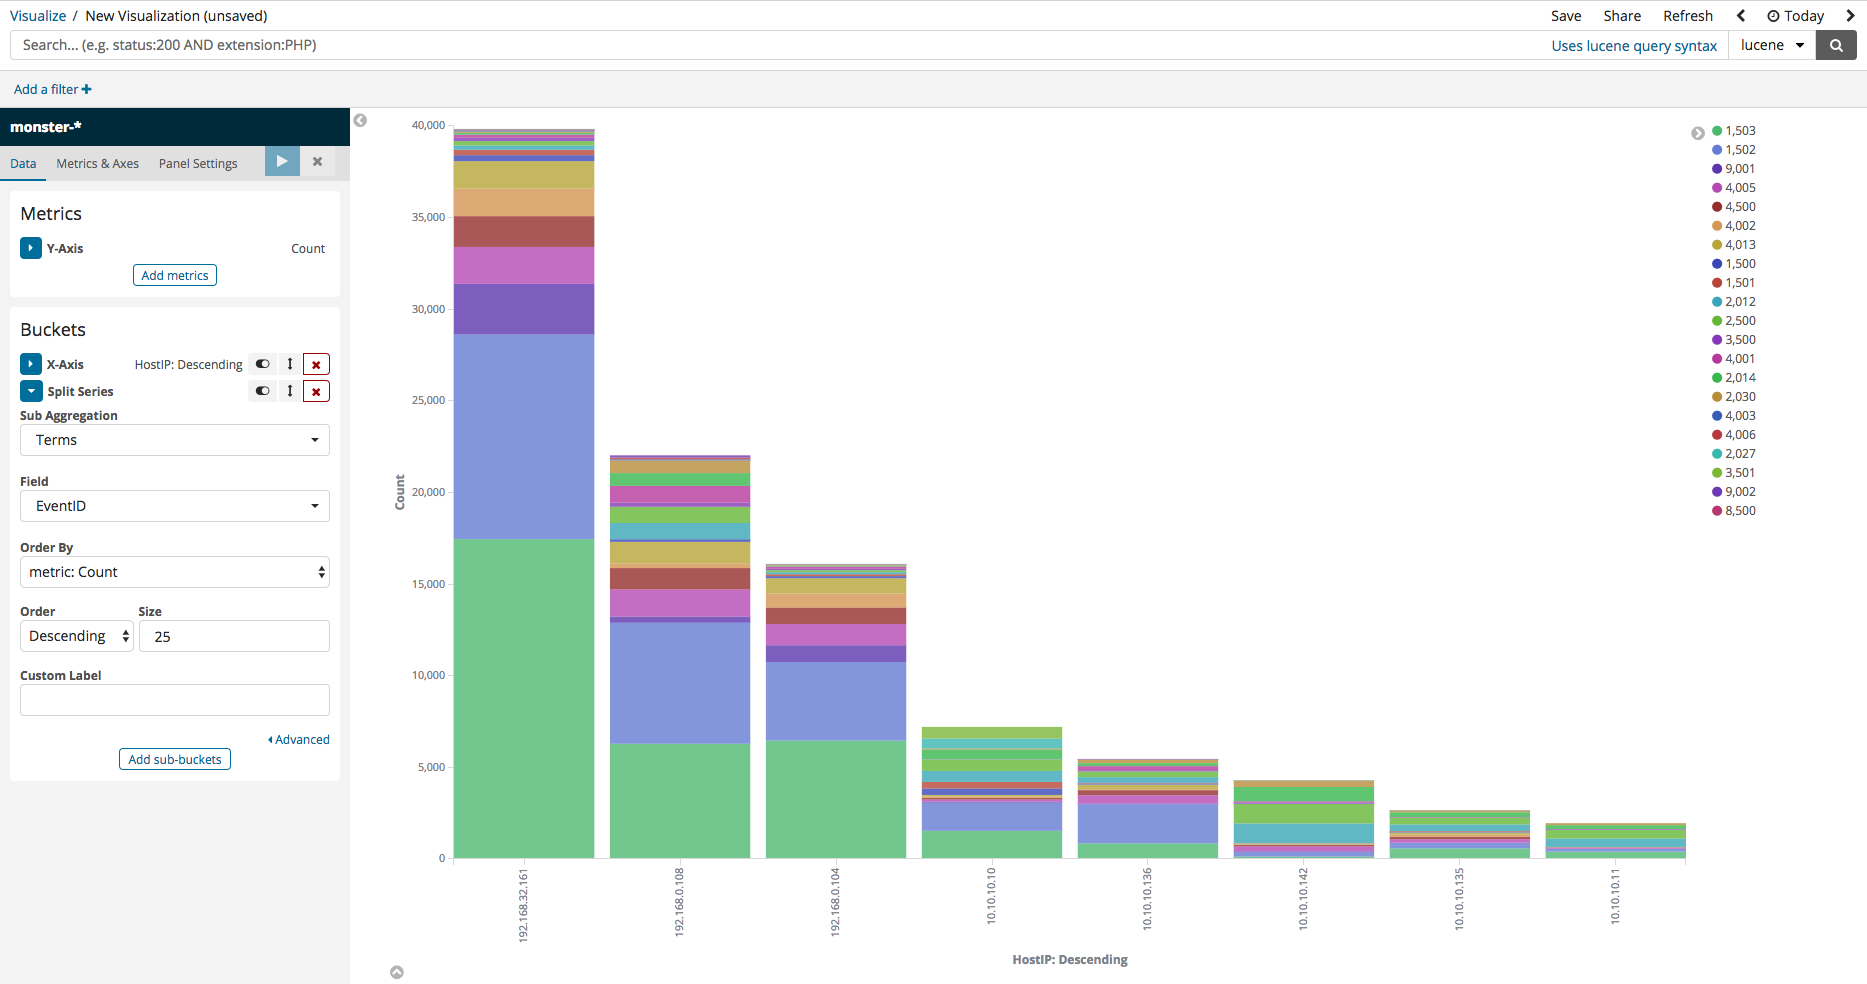
Next, press Add-Sub-buckets, then select Split Series. Mirroring that which is displayed on the image below, select ‘Terms’ as the Sub Aggregation, then select ‘EventID’ as the Field, and you should be able to see data neatly divided according to ID.
TimeLion
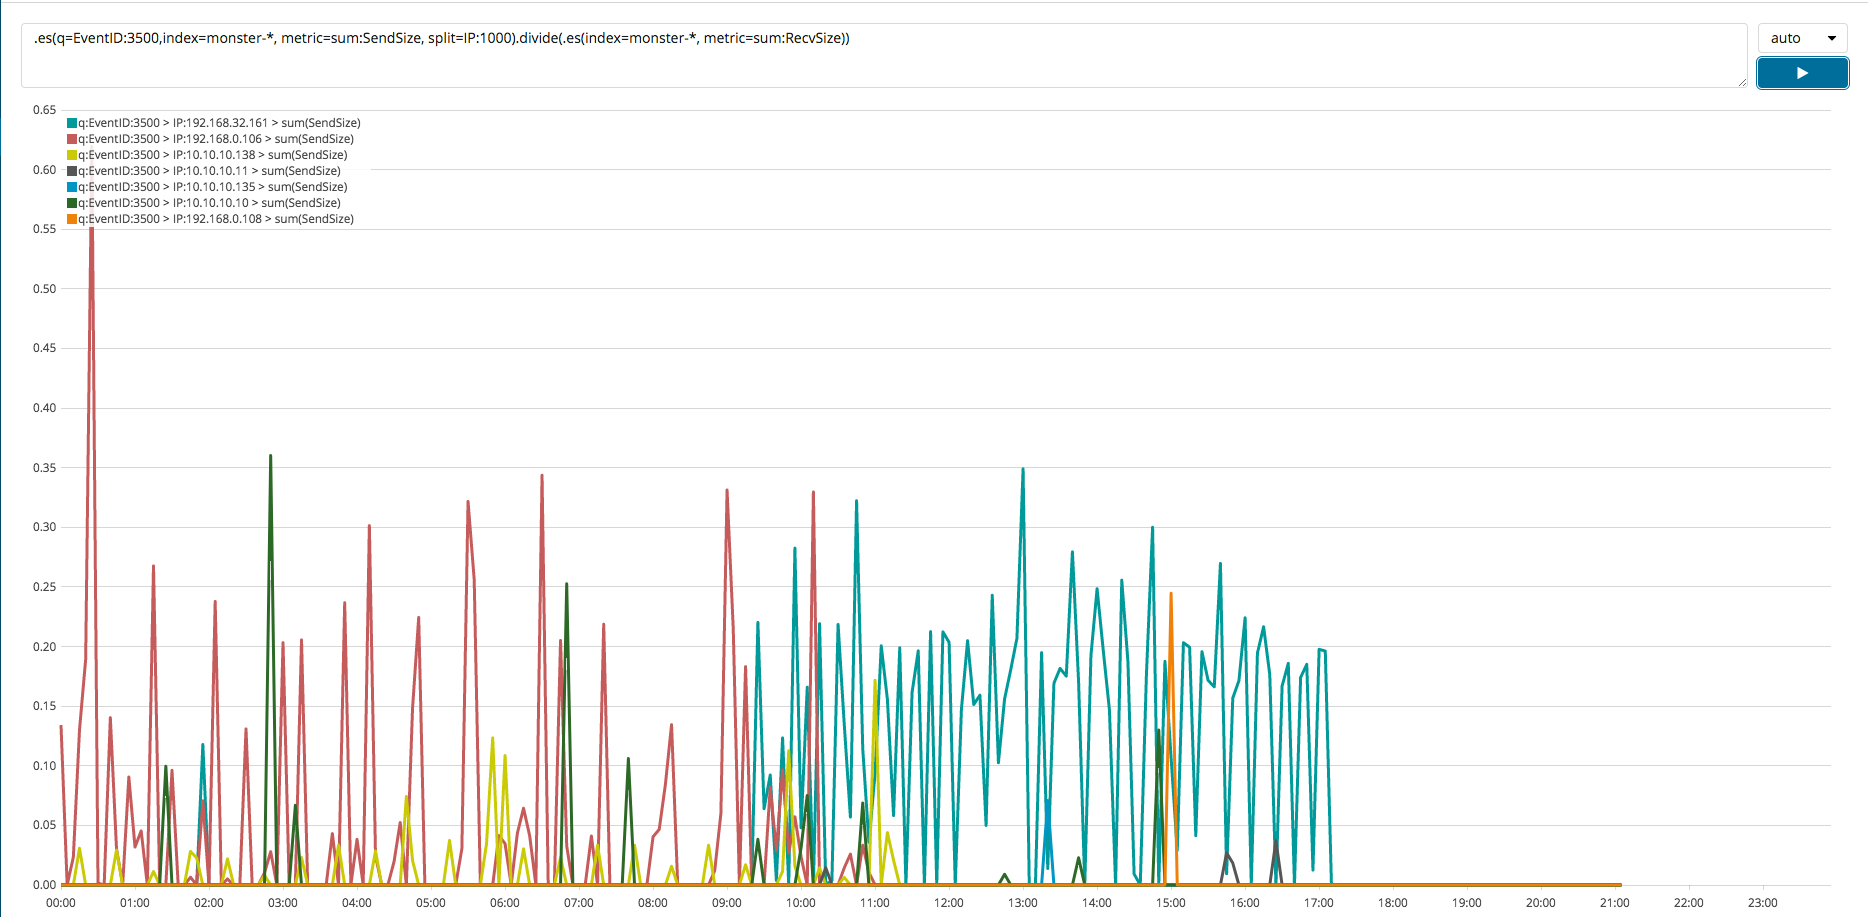
In this section, a simple example will be shown of a time series analysis. Upon dividing the sum of the data sent from the host to an external system with the sum of the data received from an external system, if the result is greater than 1, then that indicates that there is a greater outflow than an inflow of data. This type of analysis can be useful in identifying whether local systems are leaking data to external systems. TimeLion can be used to perform a wide variety of time series analyses similar to this one. By using a query like the following one, an analysis can be performed similar to that visualized in the image below.
.es(index=monster-*, metric=sum:SendBytes, split=IP:1000).divide(.es(index=monster-*, metric=sum:RecvBytes))
Dashboard
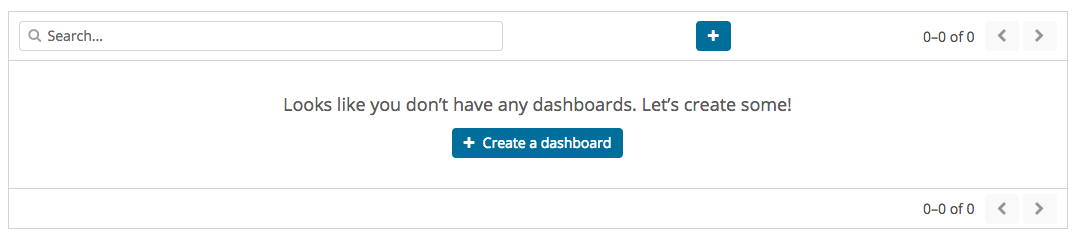
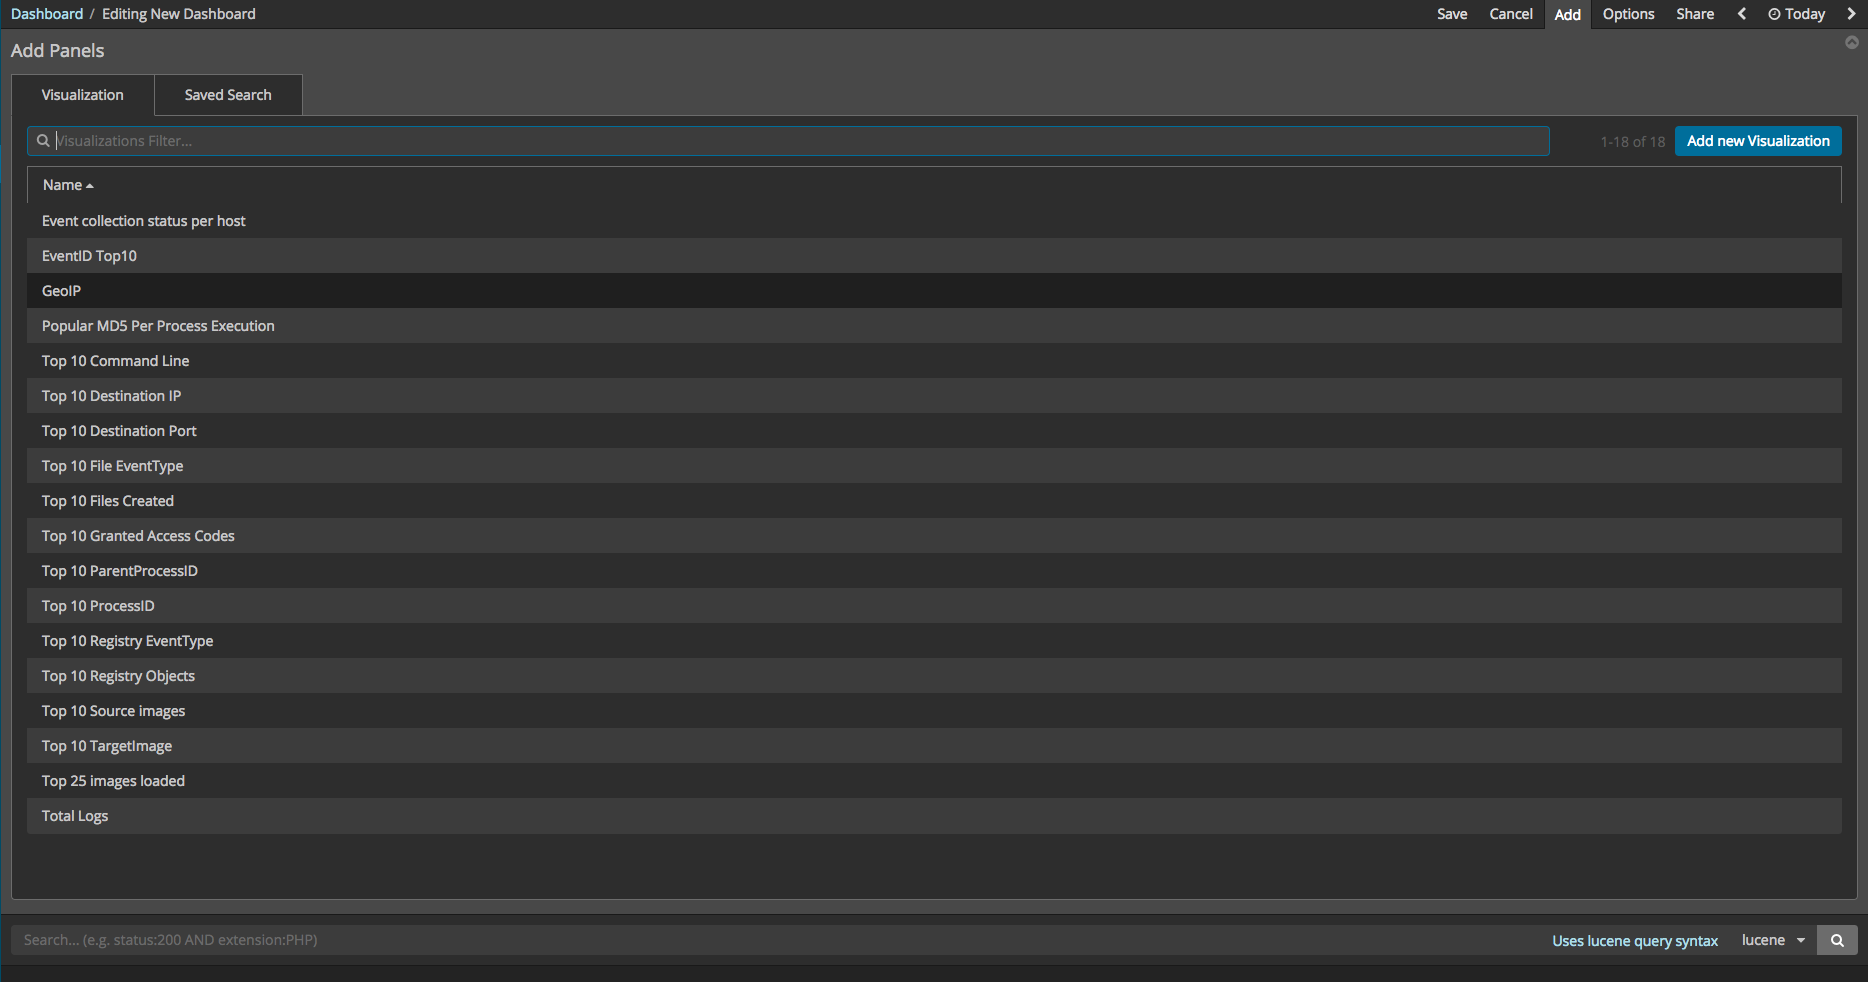
So far, the ways in which the individual visualizations and elements can be made have been explained. These visualizations and elements can now compose the dashboard using Kibana. First, start Kibana. If there are no dashboards, then the Create a dashboard button can be pressed to create one, revealing a screen allowing you to create a dashboard. By pressing the Add button, you can add the individual visualizations and elements to the dashboard, arranging them in the way that you prefer. After all your selections have been made, press the save button. The total event log number visualization can be created using 42 Metric.
Discover
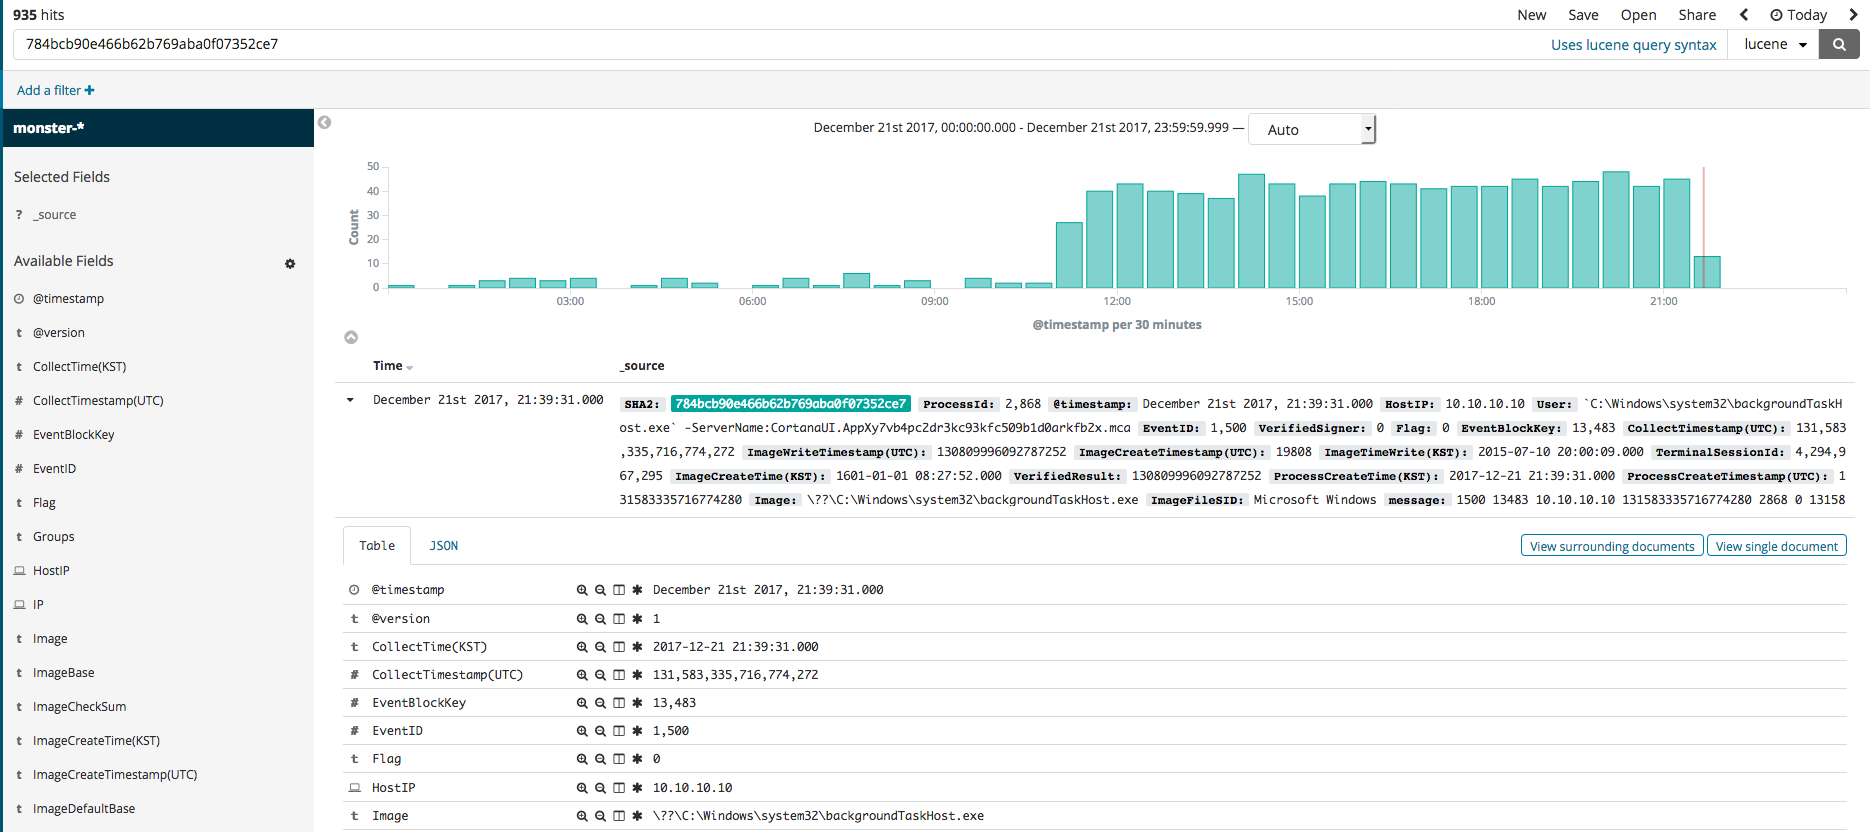
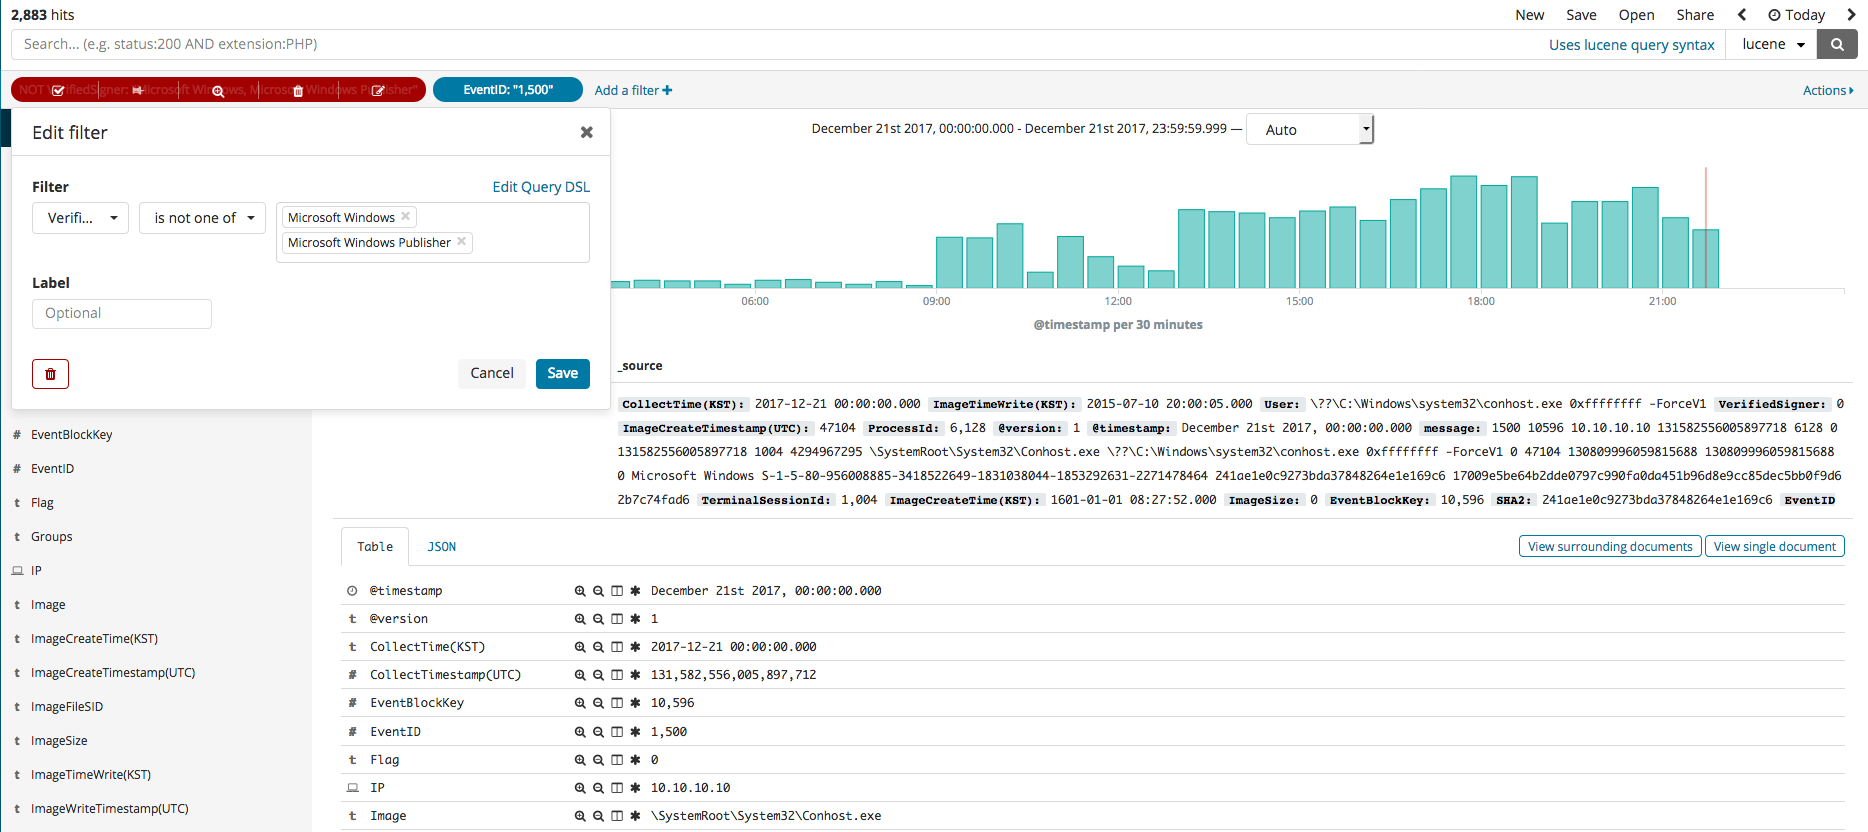
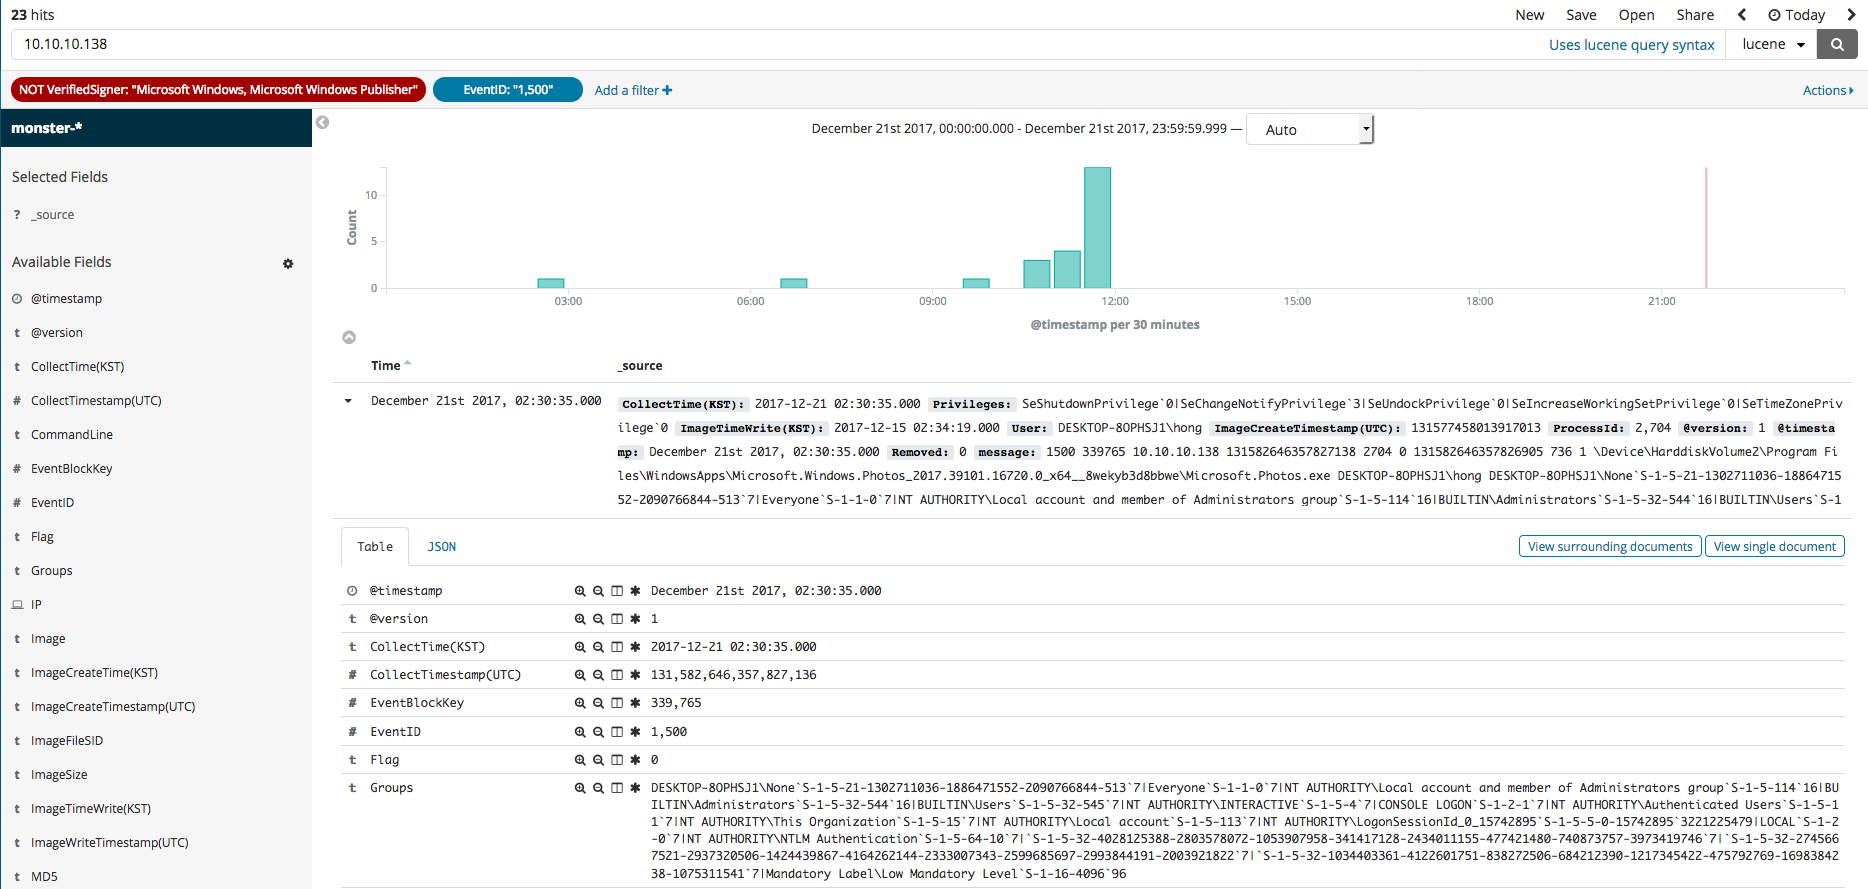
In this section, we will explore the Kibana feature called Discover that can be used for the searching and filtering of event logs. Once you select the Discover menu, the search engine can be seen, where the name of the data, along with any desired color data filters, can be used in your search. For instance, if you search for the SHA2 hash value, you should see something similar to the first image below. The second image shows the editing of the filter to see all relevant search results that are not from Microsoft. The third image shows a process generation event, where an IP of a, as was done in the second image, non-Microsoft related search result can be searched.
Extra Resources
- Introduction to Elasticsearch and a comparison of terminology with that of relational databases
- https://www.slideshare.net/clintongormley/cool-bonsai-cool-an-introduction-to-ElasticSearch
- Building a Sysmon Dashboard with an ELK Stack
- https://cyberwardog.blogspot.kr/2017/03/building-sysmon-dashboard-with-elk-stack.html
- Monitoring for Windows Event Logs and the Untold Story of proper ELK Integration
- http://www.ubersec.com/2017/12/03/monitoring-for-windows-event-logs-and-the-untold-story-of-proper-elk-integration/